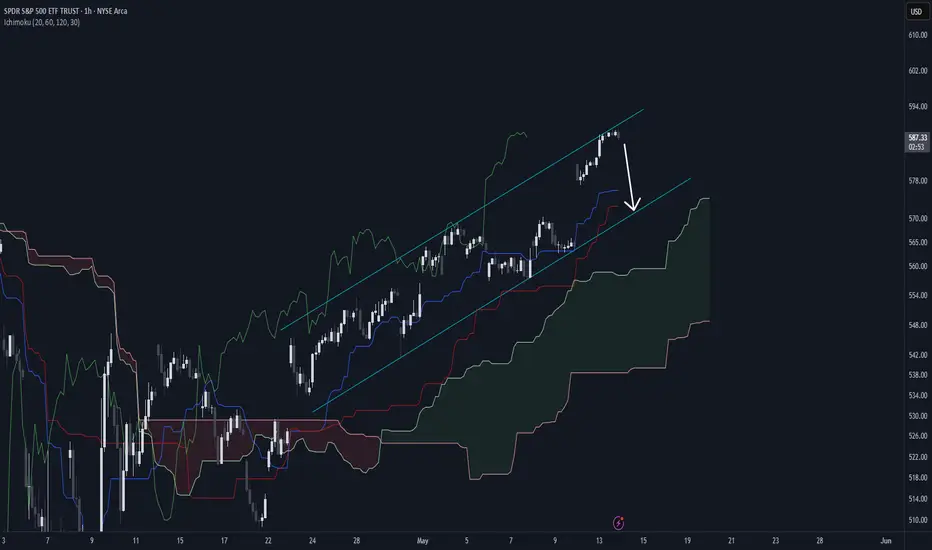
SPY Broke The Sine-Wave Center - Not GoodWe see the 3 tiny arrows—proof that price was rejected by those who knew.
The Trend Barrier, once solid support, cracked without resistance. Price dropped right back into the Medianline set.
The small pullback? Totally expected—just like the Medianline rules suggest. Then came the brutal drop, textbook-style, straight to the Centerline.
The springboard move back up to the U-MLH and the Trend Barrier? No surprise—if you understand the Medianline Framework. Because this is just P2.
Also—watch the white line. That’s what I call the Sine Wave. Why does it matter? Because the center point (where the red pullback arrow is) often gets breached in a fake move... right before price reverses hard. From P2: down, down, down... lower than P1.
AND THAT SHOULD SCARE THE HELL OUT OF YOU!
…if I’m right 😈
But if it fails?
Then we’re looking at a monstrous V-shape recovery—one that could send the indexes skyrocketing.
So there you have it.
What’s your direction?
Let me know—and tell me why! §8-)
SPY trade ideas

SPY BULLISH BREAKOUT|LONG|
✅SPY is trading in an
Uptrend and the index
Made a bullish breakout
Of the key horizontal level
Of 580.00$ and the breakout
Is confirmed so we will be
Expecting a further move up
LONG🚀
✅Like and subscribe to never miss a new idea!✅
Disclosure: I am part of Trade Nation's Influencer program and receive a monthly fee for using their TradingView charts in my analysis.

SPY, TIME TO BE BEAR AGAINSPY ready to start its 4hrs bearish TIME Cycle with first target 565 and around 545 by end of month (if not sooner)

$SPY May 14, 2025AMEX:SPY May 14, 2025
15 Minutes.
AMEX:SPY crossed 586 and made a high 589 levels.
Oscillator divergence.
Too far away from moving averages in 15 minutes.
So, a pull bac to 580 is on cards.
We have seen this setup many times.
Working in our favor.
I don't see any different this time too.

Dollar and S&P 500...a ratio of SPY by DXY, parallel to watchBasically modified a script I used to check a stock vs gold by ratio. Decided that was dumb since gold is the base of all money and stocks are no priced in gold. So I modified it to take the ratio of any stock by the current DXY of that time...both date and timeframe. To which this is created.
See how all points highlighted are equal on the graph and the coordinates are exact to the day, but differ in price position as the two are on different scales. You can see the parallel is quite interesting and has quite the usefulness...if only I could read charts- I do reality and not fiction.
But to those who read these like I read Chinese brail in a upside down backward bible (RIP Carlin) you can just take it that certain structures are looking to be broken or butted up against.
So take from this as much as you can and know that no matter how much AI you need to do a job- you need a mine to get the copper out to make the cables to connect the gpu lol..
Simply comment below your interpretation and where you think things are going or not...nothing is wrong except for common core- that stuff is so right, its basically left. :)

Nightly $SPY / $SPX Scenarios for May 14, 2025🔮 Nightly AMEX:SPY / SP:SPX Scenarios for May 14, 2025 🔮
🌍 Market-Moving News 🌍
🇺🇸 U.S.-China Tariff Reductions Implemented Today
The U.S. and China are set to enact significant tariff reductions today, lowering U.S. tariffs on Chinese goods from 145% to 30% and China's tariffs on U.S. goods from 125% to 10%. This 90-day agreement aims to ease trade tensions and has already spurred a market rally, with the S&P 500 gaining 3.3% on Monday.
📉 Inflation Hits Four-Year Low
U.S. inflation eased to 2.3% in April, marking a four-year low. This unexpected decline has alleviated concerns about the impact of recent tariffs and may influence the Federal Reserve's monetary policy decisions.
📈 S&P 500 Turns Positive for 2025
The S&P 500 has erased its year-to-date losses, turning positive for 2025. This shift is attributed to easing inflation and the recent U.S.-China trade agreement, which have bolstered investor confidence.
💼 Nasdaq to List New ETFs
The Nasdaq Stock Market will begin listing three new Russell Investments ETFs today, expanding investment options for market participants.
📊 Key Data Releases 📊
📅 Wednesday, May 14:
5:15 AM ET: Speech by Fed Governor Christopher Waller
10:00 AM ET: Business Formation Statistics for April
⚠️ Disclaimer:
This information is for educational and informational purposes only and should not be construed as financial advice. Always consult a licensed financial advisor before making investment decisions.
📌 #trading #stockmarket #economy #news #trendtao #charting #technicalanalysis

Drop to 571 in the cards for tomorrowMarkets are way too over extended. A correction sub 580 to wipe out over confident bulls can be expected tomorrow.
MAJOR TURN NEW UPSIDE IN ELLIOT WAVE 6350 target I have moved from a Bear to a BULL based on the the alt wave count at 4835 support I will pull 4835 as minor and major wave 4 of the 5th wave I can count it three ways and once we break above 5945/6010 I get min targets of the old high at 6147 at that point it will mark Ax 1.618 or wave 1 x .1618 both reach 6147 That should be seen as an issue But if we break above 6180 I will get a target of 6250 and a second target of 6351 see chart for projection . I have covered shorts from 5799 here at 5903 and moved to a net long at 100 % I will add to a 125 % long on a buy stop at 6010 . Best of trades WAVETIMER

SPY squeaked above the 78.6 Fib level If the daily candle holds, we could be challenging the all time high shortly thereafter. And if the weekly candle holds above...

SPY/QQQ Plan Your Trade For 5-13 : Rally 111 PatternToday's RALLY pattern suggests we will see continued upward price trending in the SPY/QQQ (and possibly BTCUSD).
I believe the continued positive news/announcements by the Trump administration is adding fuel for the current rally phase in the US markets. It is hard to ignore his tactics (like them or hate them). He is able to get things done in a way that many believe is disruptive.
Still, from what I'm hearing, the Chinese trade deal is a very broad and advantageous deal that somewhat "resets" the disparity the US has experienced for the past 20+ years with China. Overall, that is a very positive advancement in global trade.
Now, we'll have to see how the markets react to this news and is the hype is as good as the final trade deal.
Overall, the US markets are still climbing up the current FLAGGING formation (still BULLISH).
I see another Island (GAP) type of price move, which may prompt some consolidation - we'll see how things play out.
Gold and Silver are setting up double/triple bottoms across support.
BTCUSD is rallying higher within a similar FLAG formation to the SPY/QQQ.
In my mind, the markets are back to nearly where they were prior to the tariffs and early breakdown in late-February 2025. This is the "make or break" time for the markets.
Either the SPY continues higher and attempts to break above resistance - or it will start to fail over the next 5-10+ days and break downward.
Buckle up... and GET SOME.
#trading #research #investing #tradingalgos #tradingsignals #cycles #fibonacci #elliotwave #modelingsystems #stocks #bitcoin #btcusd #cryptos #spy #gold #nq #investing #trading #spytrading #spymarket #tradingmarket #stockmarket #silver

S&P500 room for growth?If you compare S&P500 trend from 2025 with previous years, you might either see two things:
Room for growth. In that scenario, later in the year we might see again see some upwards trend again. Instead of the current more or less flat line. Similar t o the year 2020.
Or you could compare this year with recession of some sort like the year 2022. Where we would end up in an overall loss of this year.
China could potentially escalate a war between India & Pakistan.
But I'm a bit more optimistic now. I hope they will rather now have a trade deal with the US instead of a war. Easing the tension of the trading wars. Putting this whole context together, we might actually see a small plus (like 8-10%) YoY for 2025. Or even a solid 15-20%?
What do you think?
See:

$SPY May 13, 2025AMEX:SPY May 13, 2025
15 Minutes.
Holding 574 levels uptrend continues towards 586 initially.
600 is a possibility by next week expiry.
If 575 is broken, then 570 should provide a strong support.

SPY/SPX: FOMC. Do we get rate cuts or do we even get a hike?!TA on SPY but I also like playing SPX.
Was seeing this as either a rising wedge, and if play (with FOMC etc.) can touch and retest
551.41 then back move back up to test 562.81 and to out at 567.85 IF market reacts well to FOMC, maybe ATH?
If not, we actually fulfill that rising wedge to 543.54 with a small gap to touch/retest at 534.54
I may sit sidelines until FOMC to catch the move and waves. Always wait for the set up to come to you! One of the rules I try to keep following but I break.
Let me know what you think. Will continue to update as it the week progresses.
Again, do your own DD. Not financial advice.

Nightly $SPY / $SPX Scenarios for May 13, 2025🔮 Nightly AMEX:SPY / SP:SPX Scenarios for May 13, 2025 🔮
🌍 Market-Moving News 🌍
🇺🇸 CPI Data Release Anticipated
The Bureau of Labor Statistics is set to release the April Consumer Price Index (CPI) data today at 8:30 AM ET. Economists forecast a 0.3% month-over-month increase, following a 0.1% decline in March. Year-over-year, CPI is expected to remain at 2.4%, with core CPI holding steady at 2.8% .
🤝 U.S.-China Trade Truce Boosts Markets
Markets rallied on Monday after the U.S. and China agreed to reduce tariffs for 90 days, easing trade tensions. The Dow Jones Industrial Average surged 1,160 points (2.8%), the S&P 500 rose 3.3%, and the Nasdaq gained 4.4%. Major tech stocks like Amazon ( NASDAQ:AMZN ), Apple ( NASDAQ:AAPL ), Nvidia ( NASDAQ:NVDA ), and Tesla ( NASDAQ:TSLA ) saw significant gains .
📈 Coinbase to Join S&P 500
Coinbase Global Inc. ( NASDAQ:COIN ) will be added to the S&P 500 index on May 19, replacing Discover Financial Services. The announcement led to an 11% surge in Coinbase shares during after-hours trading .
💎 Sotheby's to Auction $20M Blue Diamond
Sotheby's Geneva is set to auction the "Mediterranean Blue Diamond," a rare 10-carat gem valued at $20 million, today. The auction has garnered significant global interest from collectors and investors .
📊 Key Data Releases 📊
📅 Tuesday, May 13:
8:30 AM ET: Consumer Price Index (CPI) for April
8:30 AM ET: Core CPI for April
4:30 PM ET: API Weekly Crude Oil Stock Report
⚠️ Disclaimer:
This information is for educational and informational purposes only and should not be construed as financial advice. Always consult a licensed financial advisor before making investment decisions.
📌 #trading #stockmarket #economy #news #trendtao #charting #technicalanalysis

Into the closeJust a quick overview. The market is showing strength into the close, but it's possible we see a turnaround Tuesday tomorrow.

SPY Long and NeutralCurrent demand Zone confirmed,
Long entry 520
no Stop ,
Target 550
Risk management is much more important than a good entry point.
I am not a PRO trader.
In my trading plan, the Max Risk of each short term trade should be less than 1% of an account.

S&P 500 | Long Bias | News-Driven Flow | (May 12, 2025)S&P 500 | Long Bias | Bullish Breakout & News-Driven Flow | (May 12, 2025)
1️⃣ Short Insight Summary:
The S&P 500 Futures reacted strongly to unexpected news, breaking out of a consolidation zone. This created a surprise rally that liquidated many short positions, opening the door for bullish continuation.
2️⃣ Trade Parameters:
Bias: Long
Entry: After breakout from triangle pattern on 30min chart
Stop Loss: Below breakout structure / recent local low (adjust to personal risk)
TP1: Recent highs before the sell zone
TP2: Extended bullish target based on upward momentum
Partial Exits: Near any previous resistance or psychological round numbers
3️⃣ Key Notes:
✅ The price action surged right after a bullish news update involving China, which the market hadn’t priced in—creating a sharp reaction.
✅ On the 5min and 30min charts, bullish structure is clearly forming.
✅ On the 4H and Daily charts, money flow is shifting from outflows to consistent inflows, signaling strength behind the move.
❌ This doesn’t mean it’s time to short—even if we're entering a previous sell zone, it’s more of a chance to secure partial profits rather than fight the trend.
4️⃣ Optional Follow-up Note:
This setup will be monitored closely. Will update if conditions shift or structure breaks down.
Please LIKE 👍, FOLLOW ✅, SHARE 🙌 and COMMENT ✍ if you enjoy this idea! Also share your ideas and charts in the comments section below! This is best way to keep it relevant, support us, keep the content here free and allow the idea to reach as many people as possible.
Disclaimer: This is not financial advice. Always conduct your own research. This content may include enhancements made using AI.

Doesn't Seem FinishedHaven't posted here in a while, but here goes the usual blabber.
Moved from working in tech to FinTech, closer to the action now. But that came with a lot of realizations. Lot of reality checks pulverizing my forehead. Like most of us, I have become a lot more cynical with the system.
In the time I've spent trading, I haven't been wildly profitable. I am no longer young, but still have kept plenty of naivete and impulse. If I was one of the greats, I sure haven't realized it yet. I've traded since the day I turned 18, with some long breaks between. The plan was never to get rich, since my bankroll was always too small - it was to garner as much as pain and experience as I could, before I made some "real" money, so that I can bypass all the early mistakes most of us make before I incur serious, lifechanging losses. My first girlfriend's brother advised this, and it has arguably been one of the best decisions I have ever made. Thanks, Chad. If you ever find this by some miracle, hit me up for a Tsingtao. Same number, but not the same person anymore.
In the 7, almost 8 years of charting, yelling, disillusionment and spitting at Cramer, I've gone through almost every single emotion and experience a trader could have. I have made the dumbest decisions possible. I have fallen for stupid hype, and didn't act on high confidence trades that probably could've changed my life. I've sold and bought too early, too late, and just on time. I've bought high and sold low, and vice versa. I've gained nothing, and everything. I've lost the same. I'm not sure if I've found what I've set out to, but I'm sure as hell past the "Peak of Stupidity" in the Dunning-Kruger curve. I'm barely sure I know a single thing more than when I started, and that's proof I've progressed at least a tiny bit. I've studied and tried everything from Gann, Wave, Smart Money, Volume, setups, lines, curves, trend, moon cycles... and the paranoia of "market makers" most of us end up in. The truth and fact is that all these things are useful, and completely worthless as well.
In my short little life, I've seen people lose up to quarter of a million on a single trade. My ex-girlfriend's father all-inned at the top of Covid-19, and was convinced to sell near the bottom - they lost a house and a happy marriage over that. My coworker bought into CRYPTOCAP:DOGE Dogecoin/other memecoins at near the peak. His wife divorced him, and he still solicits me over text sometimes to try to get my opinion on some new shitcoin. In retrospect, my worst days are miniscule. In hindsight, all the insane losses I've punished myself and haunted myself with, was probably a penny to some of the richer kids I've met and befriended in college. I feel I have struggled so much, so hard for nothing over the years, with absolutely nothing to show for. My understanding is that there is no lottery ticket, no get-rich-quick scheme, no secret. We all know this, but we still hope. You either have to sell your soul, your life, or your dignity. Or all three. And most of the times, that's still not enough. I'm guilty of buying a few lottery tickets after a rough day, all to end up with some meaningless pieces of paper in my hand. Another $2 donated to the state.
After all these years, what I do have, however, is an ache. A desperation. A hope for something more. For what exactly? I'm sure none of us knows. Anything chased is never as good as we believe it'll be, and in that moment of realization, we only begin to yearn for something anew. And so, the cycle repeats ad infinitum.
I've let personal biases and emotions push and throw me around. Fair enough, sometimes they did lead me to some of my best trades. But often times, my worst. I'm sure we've all been there. There's no escaping that, ever. Every trader who talks of discipline and firmness of mind have never been truly broken before. You can't pretend there are no waves, and you sure aren't gliding over them; you ride alongside with them, and let them push and pull you to where you need to be. Trading against the tide is the dumbest thing we all do, and the most painful lesson you'll never stop learning.
The great thing about getting older is that you start to hurt less. You start caring less. You start accepting, rather than challenging. New things are scary and uncomfortable, and you no longer yearn for the excitement but rather the familiar. The reasonable. The simple and proven. I no longer stand in the pits or against the barriers, but in the edges and the balconies. I look down, and wonder why everyone is so difficult, so abrasive. Why can't we all sit down? My knees ache, and my back hurts. I think about how my beer costs far too much, and the emails I have to respond to tomorrow morning. I sigh, and put my concert earplugs on - can't risk losing any more hearing, or I won't be able to hear my Teams notifications.
This is all very great for risk adversity, but it kills the soul bit by bit, piece by piece. New music, new food, and new experiences are no longer as gratifying. Neuroplasticity has taken a hit, and so has my receptors. I can't remember ever feeling more bored by beautiful things until today, and I know tomorrow is only the same, but worse. We require more, spend more, yearn more as we grow, but find ourselves ever so less gratified. Our beautiful wives become just our wives, and the money is our bank account is always too small. A trip to the middle of the desert in college seemed like a dream, now a trip to Hawaii seems... inadequate.
I'm sure now, $20 at 20 is worth something close to $300 at 30. Put that against the SPY, will you?
Anyways, enough rambling. I have another high conviction call for you. Something I have enough "Fuck You" money to bet on, and my first "grown-up" play. I have made some bad calls before, and some I've probably been so right I could have been halfway to retirement by now. This is closer to the latter, I'm sure of it.
I'm not going to bother explaining everything - it's a huge waste of time like this post, and anyone interested enough should do their own due diligence. God, I sound like you guys now. Keywords are Miran, Triffin Dilemma, and my strong belief that BRICS will never put together a functioning currency. Taiwan vs China, India vs Pakistan, Ukraine vs Russia. All should wrap up soon. The tariff gambit with China and the rest of the nations is all noise, as it concluded today, for yet another 90 days. Technical indicators show a massive downtrend pending on monthly, and the market is hunting for a reason. Divergence in shorter timescales.
Worst comes to worst, maybe I'll convert back to Christianity if everything goes to shit. Give up all my material possessions, become a monk. The pope is from Chicago, and I just moved here. Perhaps a sign, but the market tells me it's a coincidence. But I'm sure my girlfriend wouldn't appreciate that, and being Korean, perhaps Buddhism would suit me better anyways.
I also changed my name, by the way. Why the hell not. Life is short, better go trading.

$SPY still bearish unless $584 and trendline break as resistanceI'll be the first to admit that the rally has gone further than I expected. That said, everything on the chart still looks like this is a bearish rally and not a new bull trend.
Unless we can break the blue trend line and the strong overhead resistance between $581.63 and $583.57, I think the most likely scenario is we fall further and see one last leg down before we bottom.
I think the bottom will come between the lower supports at $409 and $538.
Again, invalidation of the bearish idea is a break and flip of the resistances above, the upside targets are on the chart as well.
Let's see what happens over the coming weeks.

SPY/QQQ Plan Your Trade for 4-12 : Rally In CountertrendIn today's video, I try to highlight the TREND features in the SPY CYcle Pattern data window for all of you to use.
Yesterday, I received a comment from a friend/client asking about the strength in the markets compared to my expectations.
My answer was simple. The SPY Cycle Pattern data window shows Short-Term (ST), Long-Term (LT) trending as well as the Daily/Weekly Bias trends.
Traders should use these to determine the primary trend/direction of price action.
Additionally, I try to add my own thoughts/context related to the market setup/structure. That is where I teach you about the EPP/Cradle patterns and more.
Ideally, my analysis and the SPY Cycle Patterns align with the future price moves in a way that everyone can profit from the highest probability outcomes.
There are times when news or outside forces drive the market trend beyond my expectations and, in some cases, beyond the SPY Cycle Pattern predictions. This recent Trump-Pump rally may be one of those cases.
Either way, I continue to try to deliver the best technical analysis and research I can offer for followers.
Get some.
#trading #research #investing #tradingalgos #tradingsignals #cycles #fibonacci #elliotwave #modelingsystems #stocks #bitcoin #btcusd #cryptos #spy #gold #nq #investing #trading #spytrading #spymarket #tradingmarket #stockmarket #silver

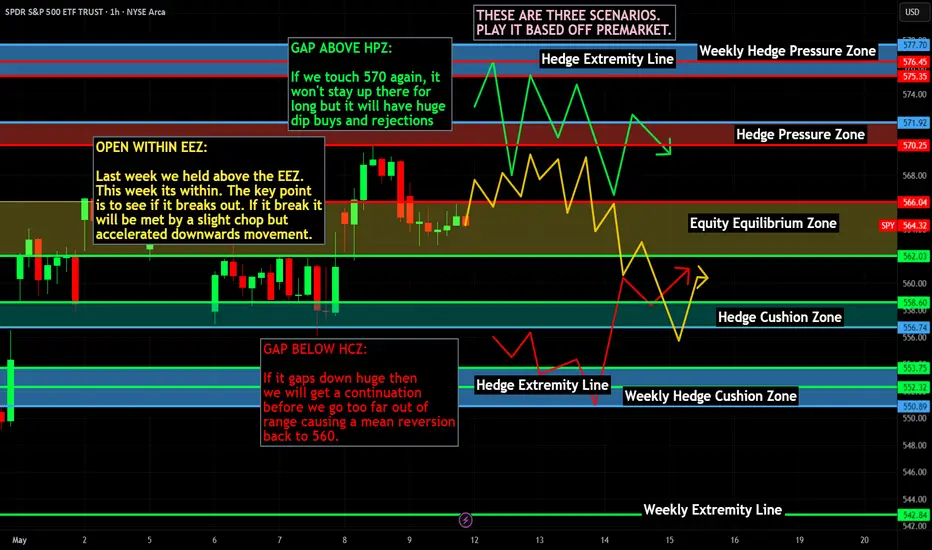
SPY WEEKLY 12 MAY 2025Welcome to Spy weekly. I have tried my best to explain the price action here. If you have any doubts, feel free to leave a comment or DM me.
NOTESTAY AWAY FROM OPTIONS

Weekly $SPY / $SPX Scenarios for May 12–16, 2025 🔮 Weekly AMEX:SPY / SP:SPX Scenarios for May 12–16, 2025 🔮
🌍 Market-Moving News 🌍
📊 Inflation and Retail Sales Data in Focus
Investors are closely watching this week's release of the Consumer Price Index (CPI) on Tuesday and Retail Sales data on Thursday. These reports will provide insight into inflation trends and consumer spending amid ongoing tariff concerns.
🤝 U.S.-China Trade Talks Resume
High-level trade discussions between the U.S. and China are set to continue this week in Switzerland. The outcome of these talks could significantly impact global markets and investor sentiment.
💼 Key Corporate Earnings Reports
Major companies including Walmart ( NYSE:WMT ), Cisco ( NASDAQ:CSCO ), Applied Materials ( NASDAQ:AMAT ), and Take-Two Interactive ( NASDAQ:TTWO ) are scheduled to report earnings this week. These reports will offer insights into consumer behavior and the tech sector's performance.
🏦 Federal Reserve Speeches
Federal Reserve Chair Jerome Powell is scheduled to speak on Thursday, with other Fed officials also making appearances throughout the week. Their comments will be analyzed for indications of future monetary policy directions.
📊 Key Data Releases 📊
📅 Monday, May 12:
No major economic data scheduled.
📅 Tuesday, May 13:
8:30 AM ET: Consumer Price Index (CPI) for April
📅 Wednesday, May 14:
10:30 AM ET: EIA Crude Oil Inventory Report
📅 Thursday, May 15:
8:30 AM ET: Retail Sales for April
8:30 AM ET: Producer Price Index (PPI) for April
8:30 AM ET: Initial Jobless Claims
9:15 AM ET: Industrial Production and Capacity Utilization
10:00 AM ET: Business Inventories
2:00 PM ET: Federal Reserve Chair Jerome Powell speaks
📅 Friday, May 16:
8:30 AM ET: Housing Starts and Building Permits for April
10:00 AM ET: University of Michigan Consumer Sentiment Index (Preliminary) for May
S&P Global
⚠️ Disclaimer:
This information is for educational and informational purposes only and should not be construed as financial advice. Always consult a licensed financial advisor before making investment decisions.
📌 #trading #stockmarket #economy #news #trendtao #charting #technicalanalysis