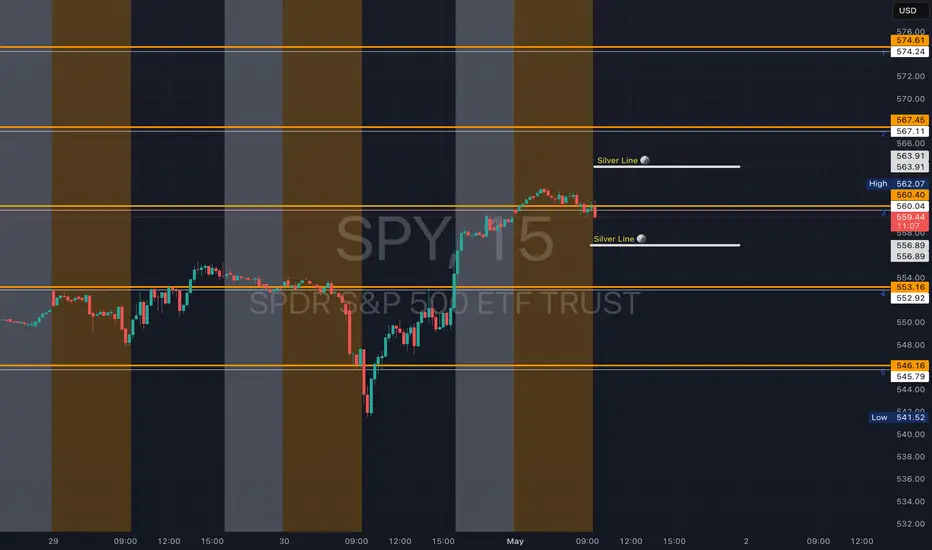
SPY - support & resistant areas for today May 1 2025These are Support and Resistance lines for today, May 1st, 2025, and will not be valid for the next day. Mark these in your chart by clicking grab this below.
Yellow Lines: Heavily S/R areas, price action will start when closing in on these.
White Lines: Are SL, TP or Mid Level Support and Resistance Areas, these are traded if consolidation take place on them.
Silver Lines: An Area where price action could happen and do work on a choppy day.
SPY trade ideas
SPY - short-term analysishi traders,
Let's have a look at SPY on 1h time frame.
As we can see the price created a double bottom and with the catalyst (Trump paused tariffs), the price pumped 11%.
It's approaching the resistance area and bulls are not out of the woods yet.
I expect a short-term pullback.
RSI is very overbought in 15 15-minute time frame which confirms this thesis.
Entry, target, and stop loss are shown on the chart.
Risk-reward ratio: 3,13

A perfect masterpiece - my final trade & mic dropHello friends. I have found the perfect trade, and I went all in with my entire account because my conviction is so high that I can say I'm 99.9% sure that I will be correct. I have never been this confident about a trade in my entire career to date.
I have purchased six figures in put contracts on the SPY and SPX because I can see that a crash is about to happen. Here are a few of the factors that I am looking at which have made me so confident.
1) Retail is frantically buying the dip as well as the rip, and they are almost always wrong & lose money. Meanwhile, smart money has been selling this whole time.
2) My wave theory shows a clear WXY pattern that has now been completed. We can't currently be in an impulsive wave to the upside because there is too much overlapping.
3) Trade deal is NOT coming soon. Polymarket predicts only 19% odds for a US-China trade deal to happen before June. The tariff situation does not look good, and it isn't priced in anymore as we have retraced the entire tariff dump already.
4) The market is currently trading far above liquidity based fair value, which has been plummeting in recent weeks indicating that a drop is bound to happen soon for risk prices. To reach the fair price, the SPY should trade about 30% lower than current prices. This gives us enormous room for a cascade to the downside.

12pm updateThe move up looks finished. If it's correct that a C wave is next we will have minimal bouncing down to around 540 on SPY. Vix is now showing 4 hour bullish divergence, so an attempt at 28 resistance is expected (as of now)

If you think the 2025 bottom is in you couldn't be more wrongIf you think the bottom for 2025 is in and it's only up from here let me have what you're smoking.
Just a puff, please!
About 80% of social media retail traders are confidently calling a bottom, that's a major contrarian signal.
Herding equals danger!
If everyone is bullish, most are already positioned long leaving a few buyers to push prices higher.
It's known as "pain trade" where markets often move in the direction that causes the most discomfort.
Many of loudest voices are retail traders influencers chasing engagement, not portfolio managers or data driven strategists.
AMEX:SPY SP:SPX NASDAQ:QQQ AMEX:DIA NASDAQ:META NASDAQ:NVDA NASDAQ:MSFT NASDAQ:GOOG NASDAQ:AAPL NASDAQ:AMZN

SPY/QQQ Plan Your Trade For 5-1 : Bottom-104Today's Bottom pattern suggests the markets will attempt to move downward - trying to find support.
Even though it may appear my May 2-5 Major Bottom pattern will not happen as I expect - this is a very good lesson for traders.
I'm not 100% accurate all the time. Sometimes, the markets do things that are not aligned with my research/patterns and sometimes the markets can be far more irrational than traders expect.
For example, I believe this current rally is more of a speculative rally in the SPY/QQQ/BTCUSD. There is nothing I'm seeing in the Crash Index (or TRAN) to support this upward price move other than traders attempting to "buy the dip".
Ultimately, I believe the current contraction in the global economy based on policies, tariffs and economic disruptions will continue to drive a consolidation, basing type of price trend, traders are buying into this dip and attempting to drive price upward on expectations of a growing global economy.
Time will tell how things play out - but my longer-term modeling systems are still Bearish.
I will be on the road with my father today - so I'm not going to be as available to answer questions.
Watch this video twice if you need to. It will be interesting to see how the next 5+ days in the markets play out.
As I stated, I'm not 100% accurate all the time. I do my best to try to help guide all of you through these market trends with my research and cycle patterns - but, that is not enough to guarantee 100% accuracy on any trade.
That's just how it is in the world. No one is 100% perfect at predicting market moves.
Get some.
#trading #research #investing #tradingalgos #tradingsignals #cycles #fibonacci #elliotwave #modelingsystems #stocks #bitcoin #btcusd #cryptos #spy #gold #nq #investing #trading #spytrading #spymarket #tradingmarket #stockmarket #silver

SPY - dump or bull market is back?hi traders,
Some months ago, we shared the idea where we explained that SPX will experience a correction:
The targets were reached, and next we saw a decent bounce, which is very well visible on the monthly candle.
Today, I see a lot of excitement about the monthly close, and many people call for a new all-time high soon.
I want to bring to your attention the monthly close in 2000.
It looks very similar to what we got yesterday.
A long, lower-shadow wick resulted in a bearish imbalance characterised by an excess of sellers, exerting downward pressure.
I still can see SPY/SPX retesting 570-580 levels, but it doesn't change the fact that lower levels may be tested in the next few weeks/months.
We got a bearish cross on the monthly time frame, which is not a joke.
If bears take control, I expect SPY to visit 460~ levels and later even lower: 410-408.
Long story short:
1. Short-term bounce may continue.
2. Mid-term - bears will take control, and we will see a bigger correction.
Do you agree? Share your opinion in the comments section

Candlestick Patterns + Trend and Momentum: A Perfect CombinationCandlestick patterns provide valuable insights into price action, showing potential reversals, continuations, or market indecision. However, to significantly improve their effectiveness, combining candlestick analysis with trend and momentum indicators is essential. Here’s how you can use these combinations to trade with more confidence and accuracy.
1. Why Candlestick Patterns Matter
Candlestick patterns visually represent traders’ psychology through price movements, including four key prices: Open, Close, High, and Low. Some of the most common and useful patterns include:
Doji: Indicates market indecision and potential reversals.
Hammer & Hanging Man: Signals possible trend reversals at support or resistance.
Engulfing Pattern: Often marks the beginning of a significant reversal.
Morning/Evening Star: Combination patterns that strongly suggest a trend reversal.
2. Adding Trend and Momentum Indicators
Candlestick patterns alone might lead to false signals or confusion. By pairing them with other technical tools, such as moving averages, RSI (Relative Strength Index), or MACD (Moving Average Convergence Divergence), you gain crucial context to confirm the reliability of the patterns.
Here’s how:
Trend Alignment:
Using moving averages, such as the 20 or 50-period EMA, helps confirm whether a bullish candlestick pattern appears in an uptrend (strengthening the signal) or countertrend (potentially weaker signal).
Momentum Confirmation:
Oscillators like the RSI or MACD can confirm the underlying momentum behind a candlestick pattern. For instance, a bullish engulfing pattern becomes more reliable if it coincides with RSI moving upward from oversold territory or MACD showing a bullish crossover.
Volume Analysis:
Higher volume on the candle that forms the pattern typically confirms increased market interest and strengthens the validity of the signal.
3. Practical Example: Bullish Engulfing + RSI
Imagine you spot a bullish engulfing pattern forming at a clear support level after a downtrend:
Step 1: Identify the Pattern: Confirm the bullish engulfing visually.
Step 2: Check RSI: Ensure RSI is below 30 or rising, signaling oversold conditions and potential bullish momentum.
4. Why This Approach Works
Enhanced Accuracy: Combining candlestick signals with trend and momentum indicators increases signal reliability.
Improved Risk Management: Clearer signals mean more confident entries and better-defined stop-loss levels.
Reduces False Signals: Multiple confirmations reduce the risk of false breakouts or reversals.
5. Final Tips
Always look for multiple confirmations (trend, momentum, volume) before making trade decisions based solely on candlestick patterns.
Be patient—waiting for full confirmation can help avoid premature trades.
Regularly backtest and practice recognizing these combined signals to strengthen your trading strategy.

SPY Eyeing Breakout — Trump Buzz & Options Walls Fuel Fire I'm breaking down SPY here the way I process it while flipping between daily and 1-hour charts.
Daily Timeframe:
The price action is flirting right at the top of this falling wedge pattern. What catches my attention is the strength in MACD and Stoch RSI—they're both pushing hard to the upside. This isn't a weak bounce. Momentum looks real, and we're sitting just under the 555–560 resistance range, which also happens to line up with a key structure break. If we can close above this upper wedge line, bulls might get the weekly breakout confirmation.
1-Hour Chart + GEX:
Now on the hourly, SPY already broke through the 550 level and hovered at 559 into the close. There’s some strong intraday buying volume confirming that breakout. But what's even more important to me is what GEX is showing—there’s a massive cluster of call walls stacked at 555 and 560. Today, the gamma flipped from neutral to green, and GEX data confirmed there's strong call exposure at 560. Meanwhile, the highest negative NETGEX put support sits deep at 545. This creates a strong upward magnet as long as we stay above 547.
Also, there’s buzz from today’s Trump investor roundtable. Headlines from that are already driving bullish sentiment, especially with tech and AI names in the mix. That political tailwind could be the final push that launches SPY through the wedge ceiling.
My Trade Plan:
* If price holds above 552, I’m watching 560+ as the upside magnet.
* Break and retest 555, I’ll consider a long scalp or debit spread targeting 560–563.
* If 547 breaks, that would be a red flag—puts might activate again and drag us toward 540.
Option Bias:
With IV low and GEX sentiment flipping bullish, I prefer buying calls or verticals over selling premium. But the 560 call wall is heavy, so I’m not chasing—wait for confirmation.
This analysis is for educational purposes only and does not constitute financial advice. Always do your own research and manage risk accordingly.

AAPL Compression Before the Break? 🔥Alright, here’s my breakdown on AAPL as I walk through the chart from the daily timeframe, zoom into the hourly, and then connect it with the GEX map for a directional play this week — especially with macro eyes watching SPY and the Trump/investor meeting narrative floating around.
🟩 Daily Timeframe – Holding Uptrend but Needs a Spark
On the daily chart, AAPL is still holding above the trendline and stacking candles inside a minor consolidation. The MACD is trying to curl back up and Stoch RSI looks like it’s reloading after last week’s overbought run. This type of compression right under resistance often leads to breakout setups if buyers step in — especially if SPY keeps grinding up like it did into close today. I’m keeping $215 and $220 in sight as those are the first higher timeframe targets if bulls really get control.
⏱ 1H Timeframe – Clean Structure, But Rejected at Resistance
Zooming into the hourly, you can see how clean AAPL has been. The recent move up tapped the GEX9 and GEX10 zones around $213–$215 before sellers pushed price down hard into the $209–$210 region. That rejection was healthy, volume surged, but now price is hovering near HVL ($205), which is the GEX-projected short-term support. If bulls defend $205 and reclaim $210 tomorrow morning, we could be in for a squeeze toward $213.50–$215 again.
📈 GEX + Options Data – A Battle Near GEX Walls
GEX levels are dense here. That $213.53–$215 band is the highest positive NET GEX wall — a heavy resistance area based on call positioning. Below, PUT walls are stacked at $205 and $200, with the -48% support at $200 acting like a trapdoor if bears take control.
But here’s what’s interesting:
* IVR is low (40.1), IV is steady, and the Options Oscillator shows some mixed interest.
* If the market mood improves (and SPY breaks out), this could become a gamma squeeze magnet toward $220.
* On the flip side, if AAPL can’t reclaim $210 early tomorrow, we may drift to retest $205 or even get a nasty flush to $200, especially with earnings risk nearby.
💡 What I’m Thinking:
This looks like a coiled spring. If SPY continues to rise and the Trump/investor meeting adds positive sentiment, AAPL might ride the flow toward $213–$215 and beyond. I’m watching the $210 reclaim as a trigger — no entry unless that happens. Options-wise, calls above $215 are aggressive but could pay off on momentum. Safer trades lie near the money for weekly scalps.
If AAPL fails $205, I might flip bias for a quick PUT scalp down to $200.
🛠 Suggested Trade Setups:
Bullish: If price breaks and holds above $210, look to long toward $213.50–$215 with stop under $207.
Bearish: If $205 fails, PUTs targeting $200 with a stop over $208 could work. Ideal setup would be a fake push toward $210 that gets rejected.
Disclaimer:
This analysis is for educational purposes only. Not financial advice. Always do your own due diligence and manage risk accordingly.

Nightly $SPY / $SPX Scenarios for May 1, 2025 🔮 Nightly AMEX:SPY / SP:SPX Scenarios for May 1, 2025 🔮
🌍 Market-Moving News 🌍
🇺🇸 Q1 GDP Contraction Raises Recession Fears
The U.S. economy shrank for the first time in three years, down 0.3% in Q1. Weaker government spending and a rise in imports ahead of Trump’s tariff policies are weighing on growth outlook.
📈 Big Tech Lifts the Market
Strong earnings from Microsoft ( NASDAQ:MSFT ) and Meta ( NASDAQ:META ) have boosted sentiment. Meta’s revenue guidance and capex surge point to aggressive growth positioning in AI and infrastructure.
🏛️ Treasury Refunding Outlook in Focus
Markets are watching the quarterly refunding announcement for clues on upcoming bond issuance. This could influence rate volatility as the Treasury balances deficits and market demand.
🌐 Risk-On Mood Despite Macro Headwinds
Global stocks notched a 4-week high as traders bet on resilient earnings and central bank policy steadiness, even as U.S. macro data softens.
📊 Key Data Releases 📊
📅 Thursday, May 1:
📈 Initial Jobless Claims (8:30 AM ET)
Tracks new unemployment filings – a key gauge of near-term labor market stress.
📈 Continuing Jobless Claims (8:30 AM ET)
Measures ongoing unemployment benefit recipients, reflecting persistent joblessness.
🏗️ Construction Spending (10:00 AM ET)
Reports monthly change in total construction outlays — a direct measure of real economy investment.
🏭 ISM Manufacturing PMI (10:00 AM ET)
Provides a snapshot of U.S. factory activity. Readings below 50 suggest contraction.
⚠️ Disclaimer:
This information is for educational and informational purposes only and should not be construed as financial advice. Always consult a licensed financial advisor before making investment decisions.
📌 #trading #stockmarket #economy #news #trendtao #charting #technicalanalysis

SPY - 700 is not impossibleA sneaky expanding diagonal for cycle wave 5 with a blow off extended 5th primary wave (final wave) makes the most sense to me. If that's what we are seeing right now, SPY might possibly hit low 700s in the next couple of years. Gold might pull back to low 200s in the meantime for a choppy wave 4. My plan is to switch from equities to gold at spy 700. Not a financial advice. This post is for educational purpose only

V-shaped Recovery SPY to 570-580 We formed a diamond bottom last week and had a false breakout to the downside that quickly turned bullish after it was revealed that Trump was just "trolling" when he mentioned wanting to fire Powell. Once we broke the soft 536 resistance we moved right to the downward trendline (drawn in yellow) hovered there briefly and then cracked through it.
We ended last week with a bullish engulfing on the weekly chart and spent these first 3 days at the high.
Good earnings kept the market bullish and in the last hour a mineral deal was signed with Ukraine.
The bears have little left in the tank, Tariffs look like they are going to be solved in the near future and fear is decreasing. Promising news on Ukraine is turning the wall of worry into a wall of excitement.
This is not feeling like a bear market rally, this is looking like the next phase of a bull market.
The decline trendline from march can be flipped to bullish and we are climbing steadily on that new line, this recovery is V shaped.
I expect resistance in the 570-580 range.

Spy earnings bump up this week! up to 557 Wednesday after market close Meta & Msft earnings And Tomm is apple earnings after market close.

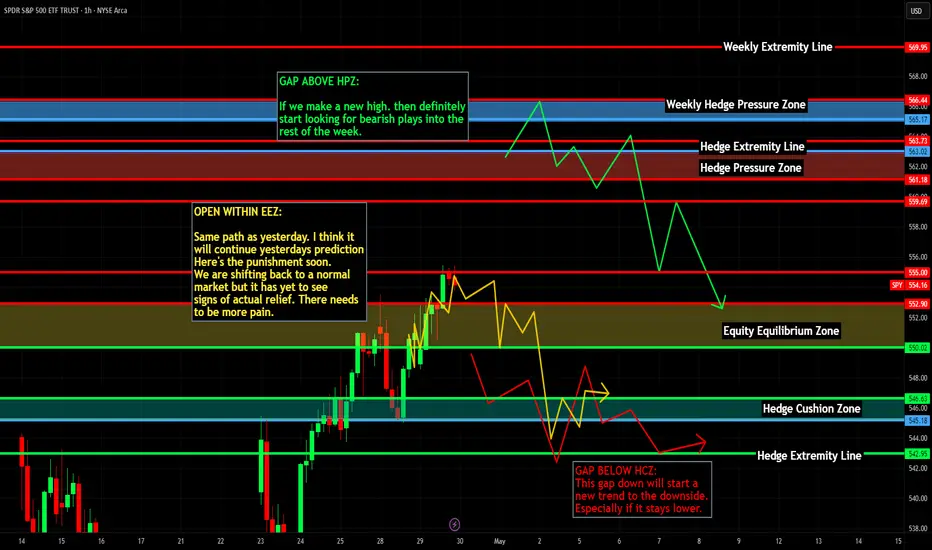
SPY/QQQ Plan Your Trade Update For 4-30 : Moving Into FlaggingThis quick update video should help you understand how my May 2-5 Major Bottom pattern could represent a move into FLAGGING within an inverted EPP pattern.
If my research is correct, the next move for the market will be a moderate downward price trend that will represent the FLAGGING portion of the inverted EPP pattern.
You've all see how bullish EPP patterns play out over the past 3 to 5+ months. Now we get to see how this recent SPY low near 480 turns into an inverted EPP pattern. This is basically the same pattern - but forming in an inverted mode.
As we transition through this inverted EPP pattern, what I'm looking for is a breakdown move to create the new FLAGGING formation. This move aligns perfectly with my May 2-5 Major Bottom pattern and could be a perfect setup for the attempted "breaking of the Flag High" in late May 2025.
I'm watching Gold and Silver stay relatively strong today. So I'm seeing today's market move as a "reversion move" - not really a breakdown move (yet).
It will be interesting to see how this plays out.
If the markets move into Flagging, as I expect, the big opportunities will be to ride the Flagging & Breakdown patterns over the next 30+ days before we move into either an INVALIDATION or CONTINUATION phase of the inverted EPP pattern.
Price is the ultimate indicator - you just need to know what to look for.
Get some.
#trading #research #investing #tradingalgos #tradingsignals #cycles #fibonacci #elliotwave #modelingsystems #stocks #bitcoin #btcusd #cryptos #spy #gold #nq #investing #trading #spytrading #spymarket #tradingmarket #stockmarket #silver

SPY QQQ NQ/ES 30 De Abril 2025SPY/ES Gamma Chart Analysis – April 30, 2025
Key Insights Based on SpotGamma Levels, Volume Profile & Option Walls:
🔴 Market Context:
SPY at 544.52, showing a significant drop of -1.78%.
The price has broken down from the upper gamma range and is now testing key support zones.
Heavy Put Walls and Call Walls are defining psychological and gamma-driven price magnets.
🔵 Zones & Price Targets:
Zone Type Level Description / Reaction Expectation
🔺 Resistance 550 Strong Call Wall & Put Wall, likely a ceiling. Reversal or rejection expected.
🟨 Sell Zone 545 Marked as "Possible Sell Zone", coincides with Put Wall (1) / Call Wall (4) – watch for short entries.
🟩 Buy/Sell Zone 543.70 Neutral area, can serve as battle zone for bulls/bears. Volume shelf area.
🔻 Support 540 Converging Put Wall (3) / Call Wall (5) – strong gamma support, watch for bounce or breakdown.
🎯 Target Levels (Bearish Plan):
Target # Level Description
1️⃣ 545 Minor drop target, near-term scalp if price rejects from above.
2️⃣ 543 Medium target if selling pressure continues.
3️⃣ 540 Major target, strong support – key test for further downside continuation.
📈 Bullish Scenario (Lesser Probability Today):
Reclaim of 548–550 zone may trigger long setups with potential targets:
548 ES
550 ES
🧠 Strategic Takeaways:
"Options positioning is pointing to downside pressure unless bulls reclaim 545-548 area quickly."
Ideal setup: Short bounces into 545 with stops above 548.
Targets staggered from 543 to 540 based on gamma support layers.
Vol Trigger: 550, showing the zone where volatility starts increasing – another bearish sign.

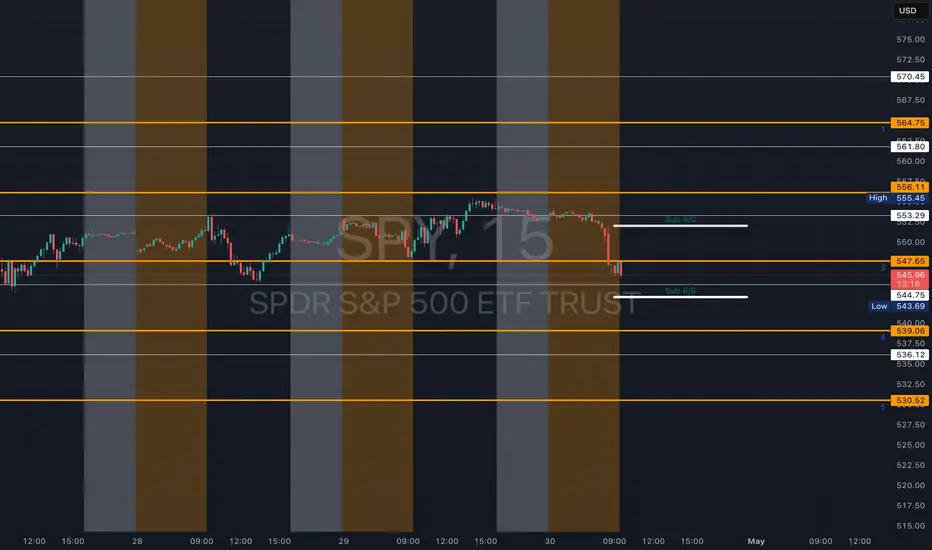
SPY - support & resistant areas for today April 30 2025These are Support and Resistance lines for today, April 30, 2025, and will not be valid for the next day. Mark these in your chart by clicking grab this below.
Yellow Lines: Heavily S/R areas, price action will start when closing in on these.
White Lines: Are SL, TP or Mid Level Support and Resistance Areas, these are traded if consolidation take place on them.
Sub R/S: An Area where price action could happen.
SPY needs to hold mondays low and recover over tuesdays lowSPY got a huge gap down due to GDP data. We should see if it will be able to hold Mondays low. Right now it is between mondays low and tuesdays low


SPY – April 29, 2025 – Where to Next After This Push?Looking at SPY on the daily chart, it’s been riding a solid recovery wave from that sharp drop in early April. The last seven sessions have all printed green candles, showing persistent demand — but now we’re pressing right into the resistance zone around $554–$555, which aligns with the top of a previous range before that breakdown. The MACD histogram is still rising, showing bullish momentum, and the Stoch RSI is curled up in overbought territory. That’s not a sell signal on its own — it just means we’re extended and probably due for a cooldown.
When I zoom into the 1-hour chart, I notice something more subtle — SPY has been grinding up within a rising wedge. The candles are getting tighter near the top channel line, and volume is starting to fade a bit. That tells me we’re at a spot where either momentum explodes higher... or this move starts to stall out.
Now, overlay that with the GEX map, and here’s what jumps out:
* $555 is a thick cluster of Call Wall and Net GEX resistance — 44.9% of second-tier call positioning is stacked there.
* Above that, $557–$560 also has GEX walls, so upside beyond $555 could get sold into unless we see strong breakout volume.
* On the flip side, $547 and $545 remain the nearest areas of downside gamma support — price tends to bounce off these zones if tested.
My Thoughts: We’re reaching a point where the path of least resistance might shift. If bulls can decisively break above $555, especially with volume and a GEX unwind, there’s room toward $557–$560. But if we get stuck here and break below $552, I’d expect some profit-taking down toward $547–$545.
Trade Setups I’d Consider:
* Bullish Breakout Trade:
Above $555 with volume
Entry: $556
Target: $559–$560
Stop: $553.50
(Ideal with IV still relatively low and GEX unwinding from that zone)
* Fade Rejection Play (If SPY can’t clear $555):
Entry: ~$554 with reversal candle
Target: $547
Stop: $556
(Volume weakness + rising wedge breakdown would support this)
Options Thoughts:
* IVR is at 29, with IVx lower than the average — premium is relatively cheap.
* GEX shows 89% PUTs, which might seem bearish, but it also suggests market makers could support pullbacks for now.
* A $555C or $560C for this week is a high-risk chase — I’d only grab it if SPY breaks and holds above $555.
* Safer might be a put debit spread targeting $547 if the rising wedge breaks down.
This week could be pivotal. SPY has had a strong run, but now it’s flirting with a crowded options zone. Watch the $555 level closely — that’s where the real decision likely gets made.

Nightly $SPY / $SPX Scenarios for April 30, 2025 🔮
🌍 Market-Moving News 🌍
🇺🇸 Bessent's Trade Remarks Stir Markets
Treasury Secretary Scott Bessent emphasized the U.S.'s readiness for a significant trade deal with China, suggesting potential easing of the ongoing tariff war. His comments have heightened investor anticipation for developments in U.S.-China trade relations.
📉 China's Factory Activity Contracts
China's April manufacturing PMI is projected to fall below 50, indicating contraction, as recent U.S. tariffs impact production. This downturn raises concerns about global supply chain disruptions and economic slowdown.
💼 Major Earnings Reports on Deck
Investors await earnings from key companies including Apple ( NASDAQ:AAPL ), Alphabet ( NASDAQ:GOOGL ), Meta Platforms ( NASDAQ:META ), Microsoft ( NASDAQ:MSFT ), and Amazon ( NASDAQ:AMZN ). These reports will provide insights into how tech giants are navigating current economic challenges.
🏛️ Treasury's Borrowing Plans Under Scrutiny
The U.S. Treasury is set to release its quarterly refunding announcement, detailing borrowing plans amid economic uncertainties and the impact of recent tariffs. Market participants will closely analyze the guidance for implications on interest rates and fiscal policy.
📊 Key Data Releases 📊
📅 Wednesday, April 30:
📈 Q1 GDP (8:30 AM ET)
Forecast: 0.3% QoQ
Previous: 2.4%
Initial estimate of U.S. economic growth for Q1, reflecting the early impact of new trade policies.
📈 ADP Employment Report (8:15 AM ET)
Measures private sector employment changes, offering a preview of the official jobs report.
📈 Chicago PMI (9:45 AM ET)
Assesses business conditions in the Chicago area, serving as an indicator of regional economic health.
⚠️ Disclaimer: This information is for educational and informational purposes only and should not be construed as financial advice. Always consult a licensed financial advisor before making investment decisions.
📌 #trading #stockmarket #economy #news #trendtao #charting #technicalanalysis
Signs of a possible topBoth spy and vix reached a possible ending target today. We'll see what it looks like tomorrow but right now my feeling is either we topped or there will be one more final squeeze to 5600 tomorrow.

$SPY Bullish and Bearish TA signals, but leaning BullishShowing multiple time frames with different TA patterns--some harmonizing, while some are conflicting. When I put it all together the sum for me is slightly bullish.
