TBT trade ideas

TBT - Possible Turn Around & Breakout IdeaIf you're going for a Long/Call position then you may want to consider putting a tight stop loss at around 30.30 where the red line is. This is just an idea so I won’t post updates here.

TBT Jan2018- 35 call to buyThere is a bubble in the bond market. Worldwide financial crises & money printing will make it collapse very soon. In this context we are considering TBT long term Call option.

TBT weekly - buy candidate - 7/14/2016Bouncing up from long term support from oversold, so it looks good. Want to see a positive MACD, a stronger RSI and maybe a more solid bottom.

TBT / Treasury - Tight area and possible pop outTBT might pop out of this tight area.
See the full newsletter here: forum.marketstockoptions.com

TBT / Treasury - Breakout + Near Support LevelI see TBT almost hitting support level.
See the full newsletter here: forum.marketstockoptions.com

TBT $42.52: Tests 17-month falling trendlineTBT rallied off 40.57 (March 30, 2015 low) to test 17-month falling trendline. Bullish indicators suggest a breakout is favored ahead of further strength towards 47.54 (March 2, 2015 high). Clearance above the latter would confirm basing and trigger further gains towards 53.63 (November 13, 2014 range high). However, a breakdown below 40.57 would signal false break and shift the focus back to 38.15 (January 26, 2015 record low).
Outlook:
Short term: Bullish
Long term: Neutral


TBT break up of bear channelThis ETF was in bear channle as we saw rotation out of Fixed Income into Equities.
Yesterday it broke down trend line ahead of tomorrow ECB meeting.
The longer it will stay above $62 the higher probability it will continue higher. Target at 50/100/200 EMA.
Higher rates could make banks more attractive.

Repost of TBT Long Bat PatternThis is a repost of my initial chart due to price having taken a few weeks to get down to the 'D' point area. I would definitely leave some room for any stop losses under that 'XA' leg in case price tries to retest the shelf its been bouncing off.
Again, I'm looking to get long around 61.30s to not miss the move. I would expect a retest of the B point, but I will usually just stick with a 1:2 R/R and move on.
Volume saw increase during ascent of the 'XA' leg and fell off during the decline and maturity of the pattern.
Also there is some noticeable momentum divergences found on both the stochastic oscillator and mac-d histogram for both the daily and weekly charts.
TBT tradeThinking to buy some TBT (ultra shot 20+ year treasury) tomorrow or early next week, pending technical development. I am long treasury - so this may be a counter-trend short term trade.

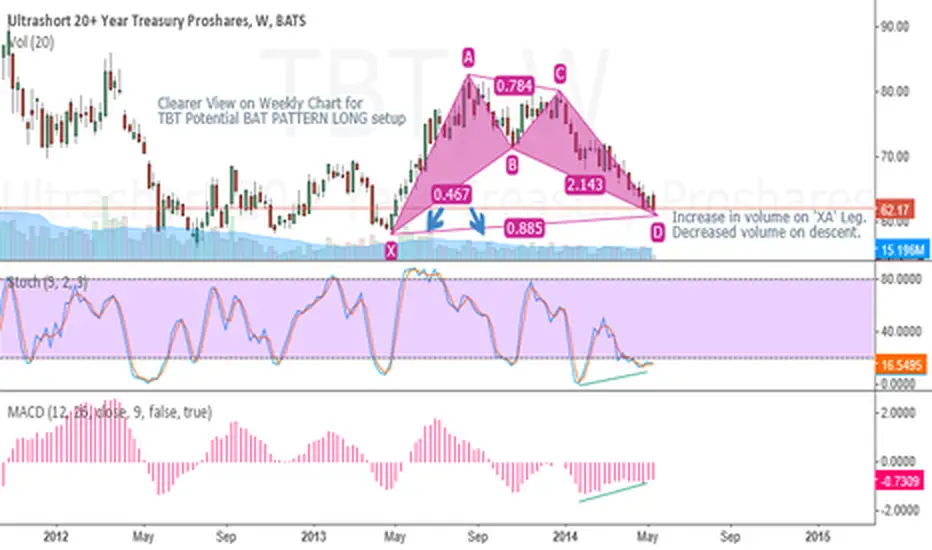
Clearer chart of Potential Bat Pattern for TBT on Weekly ChartI posted the Daily chart a couple days ago; here is the weekly chart which is a bit clearer for people.
Again, I'm looking to get long around 61.30s to not miss the move. I would expect a retest of the B point, but I will usually just stick with a 1:2 R/R and move on.
Volume saw increase during ascent of the 'XA' leg and fell off during the decline and maturity of the pattern.
Also there is some noticeable momentum divergences found on both the stochastic oscillator and mac-d histogram for both the daily and weekly charts.
Entry: 61.30
Stop Loss: 57.97
Profit Target: $67.96

Re-starting a swing long in TBT First add was 63.70 will add lower looking for rates to rise possible 67-68 1st target.

Possible Inverted Head and Shoulder PlayScanning for patterns and noticed the trend lines and patterns. Buying Puts on Weekly's and Feb 22 expiration. Keeping it simple.
If your still guessing what it is, the pattern is an Inverted Head & Shoulder.

Long TBT as rates riseTreasury yields in way up
Confluence zone
Indicators show breakout and next leg up
Wave count looks for upside


TBT (inverse TLT) pulling back to breakout supportThe breakout of the base in TBT (which is a breakdown of the top in TLT) set up a rally to the projected target created from the measurement of the first green triangle you see on the chart. This breakout pattern could very well go another measured move from the breakout level projecting up to the "MAX TARGET" within 23 days from the breakout of the range labeled "DAY 1". The small green rectangles are the previous day's range subtracted from the previous day's close. "DAY 1" is the first day where the market jumped away from the price cluster of 14-23 days and began the trend. Realize this is a leveraged instrument and it moves more than the underlying TLT. It would be roughly the same to short the TLT, but you would need more capital to set up the trade.
I believe that next week is when this trend has the chance to really take off. The reason being that it will be the start of a new quarter and that is when new decisions get made and they get made pretty aggressively especially at the beginning of the quarter. Bonds have had a bad quarter, but very likely next quarter they will have a far worse quarter as capital shifts out of bonds and into equities.
By: Technical Tim
11:17AM March 28, 2012
