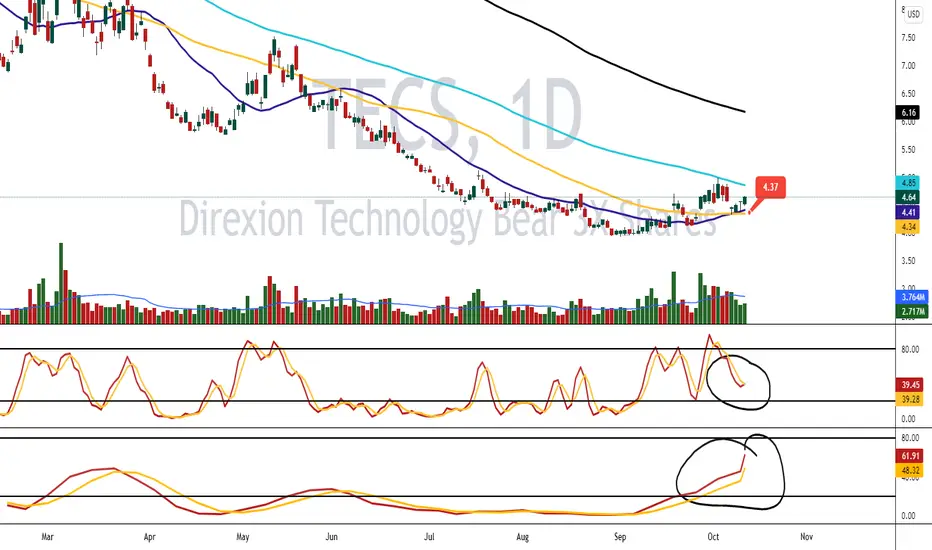
TECS/SSG Potential Long OpportunityTECS/SSG pair is signaling a Long position at the close of yesterday, supported by multi indicators, suggesting a promising opportunity.
ADX : Indicates no trend at present.
Correlation : remains very high in the last few weeks.
Close price : closed below lower BB.
Historical test : I would be
Key stats
About Direxion Technology Bear 3X Shares
Home page
Inception date
Dec 17, 2008
Structure
Open-Ended Fund
Replication method
Synthetic
Dividend treatment
Distributes
Distribution tax treatment
Ordinary income
Income tax type
Capital Gains
Max ST capital gains rate
39.60%
Max LT capital gains rate
20.00%
Primary advisor
Rafferty Asset Management LLC
Distributor
Foreside Fund Services LLC
TECS offers investors a means of playing out their bearish bets on the technology sector. The fund provides -3x exposure to the S&P Technology Select Sector Indexa market-cap-weighted index of US tech companies selected from the S&P 500. TECS tracks the exact same index as XLKthe Technology Select Sector SPDR ETF. That makes it a narrow bet against the highly concentrated tech sector, with just a few names comprising a huge fraction of the index. Unlike XLK, TECS is designed to be a short-term trading vehiclenot a long-term investment. TECS rebalances its exposure on a daily basis. As a result, the fund's long-term returns are difficult to predict due to compounding and path dependency. It is important to clearly understand the risks of utilizing such leverage. In addition, this product should only be utilized by those who actively manage their investments.
Related funds
Classification
What's in the fund
Exposure type
Cash
Bonds, Cash & Other100.00%
Cash100.00%
Top 10 holdings

INVERSE H&SInverse head and shoulders is a bullish pattern that is usually found at a bottom.
There are 2 shoulders that should be relatively close in price and a deeper valley in the middle of the 2 shoulders that forms a head.
Direxion Daily Technology Bear 3X Shares ETF. Leveraged.
The pattern is not va

Continuation Wedge (Bullish) | 46% move possibleDirexion Daily Technology Bear 3x Shares forms bullish "Continuation Wedge" chart pattern
"Continuation Wedge (Bullish)" chart pattern formed on Direxion Daily Technology Bear 3x Shares (TECS:NYSE). This bullish signal indicates that the stock price may rise from the close of $22.4 to the range of

$TECS high retest? 👁🗨*This is not financial advice, so trade at your own risks*
*My team digs deep and finds stocks that are expected to perform well based off multiple confluences*
*Experienced traders understand the uphill battle in timing the market, so instead my team focuses mainly on risk management*
First ent

$TECS a 50% gain? 👁🗨*This is not financial advice, so trade at your own risks*
*My team digs deep and finds stocks that are expected to perform well based off multiple confluences*
*Experienced traders understand the uphill battle in timing the market, so instead my team focuses mainly on risk management
My team ent

57 target bullish cypher going into bullish ABCD Patternlooking to long off of C wave or go long calls options. Bearish against the Tech sector..

$TECS market hedge 👁🗨*This is not financial advice, so trade at your own risks*
*My team digs deep and finds stocks that are expected to perform well based off multiple confluences*
*Experienced traders understand the uphill battle in timing the market, so instead my team focuses mainly on risk management
My team wil

bear flag on the weekly chart of 3x technology bear etfI'm super bullish on technology esp Apple, Microsoft, Google , FB, Amazon, Nvda all are heavyweights in the spy etf and sp500 index.. So i'm electing to short the 3x bear etf on technology.
There is a bear flag on the 3x bear etf weekly chart. The cup/handle trapped those that were bullish on this

Leveraged Inverse Technology Play TECSStop loss at 4.00, good chance it hits 5.75 before month end!! Playing Nov. $4.00 calls

See all ideas
Summarizing what the indicators are suggesting.
Oscillators
Neutral
SellBuy
Strong sellStrong buy
Strong sellSellNeutralBuyStrong buy
Oscillators
Neutral
SellBuy
Strong sellStrong buy
Strong sellSellNeutralBuyStrong buy
Summary
Neutral
SellBuy
Strong sellStrong buy
Strong sellSellNeutralBuyStrong buy
Summary
Neutral
SellBuy
Strong sellStrong buy
Strong sellSellNeutralBuyStrong buy
Summary
Neutral
SellBuy
Strong sellStrong buy
Strong sellSellNeutralBuyStrong buy
Moving Averages
Neutral
SellBuy
Strong sellStrong buy
Strong sellSellNeutralBuyStrong buy
Moving Averages
Neutral
SellBuy
Strong sellStrong buy
Strong sellSellNeutralBuyStrong buy
Displays a symbol's price movements over previous years to identify recurring trends.
Frequently Asked Questions
An exchange-traded fund (ETF) is a collection of assets (stocks, bonds, commodities, etc.) that track an underlying index and can be bought on an exchange like individual stocks.
TECS trades at 25.69 USD today, its price has risen 6.24% in the past 24 hours. Track more dynamics on TECS price chart.
TECS net asset value is 25.69 today — it's fallen 6.42% over the past month. NAV represents the total value of the fund's assets less liabilities and serves as a gauge of the fund's performance.
TECS assets under management is 84.70 M USD. AUM is an important metric as it reflects the fund's size and can serve as a gauge of how successful the fund is in attracting investors, which, in its turn, can influence decision-making.
TECS price has fallen by −7.29% over the last month, and its yearly performance shows a −59.54% decrease. See more dynamics on TECS price chart.
NAV returns, another gauge of an ETF dynamics, have fallen by −6.42% over the last month, showed a −41.06% decrease in three-month performance and has decreased by −57.92% in a year.
NAV returns, another gauge of an ETF dynamics, have fallen by −6.42% over the last month, showed a −41.06% decrease in three-month performance and has decreased by −57.92% in a year.
TECS fund flows account for 74.02 M USD (1 year). Many traders use this metric to get insight into investors' sentiment and evaluate whether it's time to buy or sell the fund.
Since ETFs work like an individual stock, they can be bought and sold on exchanges (e.g. NASDAQ, NYSE, EURONEXT). As it happens with stocks, you need to select a brokerage to access trading. Explore our list of available brokers to find the one to help execute your strategies. Don't forget to do your research before getting to trading. Explore ETFs metrics in our ETF screener to find a reliable opportunity.
TECS invests in cash. See more details in our Analysis section.
TECS expense ratio is 1.00%. It's an important metric for helping traders understand the fund's operating costs relative to assets and how expensive it would be to hold the fund.
TECS is an inverse fund, meaning it's structured to generate returns opposite to the trends of the underlying index or assets.
In some ways, ETFs are safe investments, but in a broader sense, they're not safer than any other asset, so it's crucial to analyze a fund before investing. But if your research gives a vague answer, you can always refer to technical analysis.
Today, TECS technical analysis shows the neutral rating and its 1-week rating is sell. Since market conditions are prone to changes, it's worth looking a bit further into the future — according to the 1-month rating TECS shows the sell signal. See more of TECS technicals for a more comprehensive analysis.
Today, TECS technical analysis shows the neutral rating and its 1-week rating is sell. Since market conditions are prone to changes, it's worth looking a bit further into the future — according to the 1-month rating TECS shows the sell signal. See more of TECS technicals for a more comprehensive analysis.
Yes, TECS pays dividends to its holders with the dividend yield of 6.89%.
TECS trades at a premium (0.02%).
Premium/discount to NAV expresses the difference between the ETF’s price and its NAV value. A positive percentage indicates a premium, meaning the ETF trades at a higher price than the calculated NAV. Conversely, a negative percentage indicates a discount, suggesting the ETF trades at a lower price than NAV.
Premium/discount to NAV expresses the difference between the ETF’s price and its NAV value. A positive percentage indicates a premium, meaning the ETF trades at a higher price than the calculated NAV. Conversely, a negative percentage indicates a discount, suggesting the ETF trades at a lower price than NAV.
TECS shares are issued by Rafferty Asset Management LLC
TECS follows the S&P Technology Select Sector. ETFs usually track some benchmark seeking to replicate its performance and guide asset selection and objectives.
The fund started trading on Dec 17, 2008.
The fund's management style is passive, meaning it's aiming to replicate the performance of the underlying index by holding assets in the same proportions as the index. The goal is to match the index's returns.