Bond Market - giving a warning sign?Typically, we would expect the TIP/IEF ratio to correlate with inflation. But that is NOT what we are seeing today. CPI is declining, but this ratio chart is implying that TLT is taking the brunt of it when compared to TIPS. This may be a warning signal that the bond market is discounting the of attractiveness of NASDAQ:TLT , whether due to expected issuance or underlying uneasiness of inflation rebounding. Worth monitoring here.
TIP trade ideas
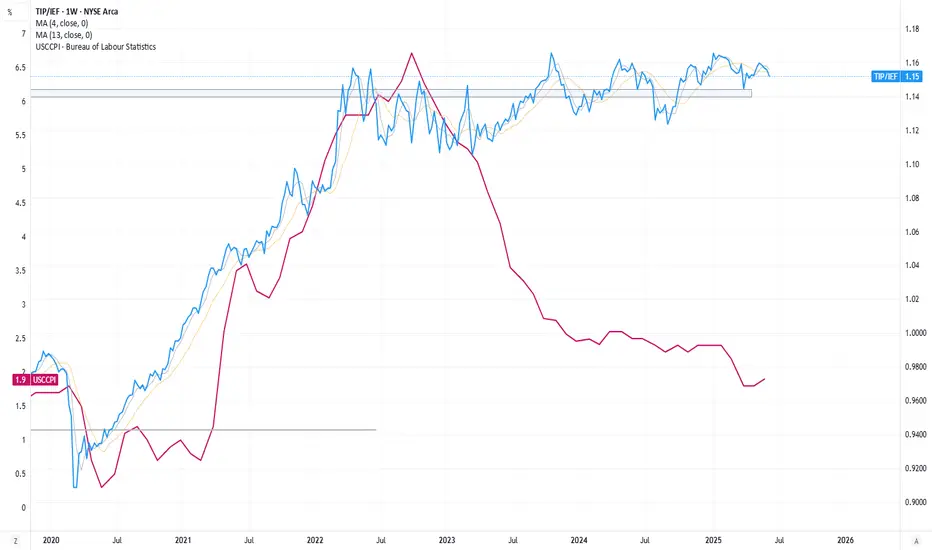
Rising Inflation Expectations: TIP vs. IEFIntroduction:
With the election concluded, market focus has shifted to bond markets, where recent developments hint at rising inflation expectations. Despite President Trump's campaign emphasis on price control, indicators suggest a shift toward higher inflation. A key metric to monitor is the ratio between Treasury Inflation-Protected Securities AMEX:TIP and 7-10 Year Treasuries $IEF. When (TIP) outperforms NASDAQ:IEF , it signals increasing inflation expectations; conversely, when IEF outperforms, it suggests a decline in inflation expectations.
Analysis:
Inflation Expectations: The TIP-to-IEF ratio is a reliable gauge of the market's inflation outlook. A rising ratio indicates growing inflation concerns, as investors favor TIPs for their inflation protection over traditional Treasuries.
Technical Pattern: Currently, the TIP-to-IEF ratio is breaking out of a descending triangle formation, a continuation pattern that signals the potential for higher inflation expectations. This breakout aligns with a recent surge in interest rates, reflecting heightened inflation concerns in the bond market.
Market Implications: This breakout could be the early stage of a sustained trend toward higher inflation, raising questions about whether the recent interest rate surge is a temporary fluctuation or the beginning of a longer-term shift.
Conclusion:
The bond market is sending signals of rising inflation expectations, as indicated by the breakout in the TIP-to-IEF ratio. This could mark the start of a new phase in the inflation cycle, with potential implications for interest rates and broader market sentiment. Traders should closely monitor this ratio to assess the longevity of the current trend. Do you think inflation expectations are set to rise further? Share your thoughts below!
Charts: (Include relevant charts showing the TIP-to-IEF ratio, the descending triangle formation, and breakout targets)
Tags: #Inflation #Bonds #Treasuries #TIP #IEF #InterestRates #TechnicalAnalysis

Inflation concerns lingering?One sign that the market may be turning skeptical on the battle against inflation is found within this chart. This chart plots the RELATIVE performance of TIPS against US Treasuries (as measured by NASDAQ:IEF ). While bond funds in general have been under pressure against stubbornly higher rates, it is the relationship here that catches the eye. Breaking out of a pennant, this TIP/IEF ratio is now poised to approach levels that have represented meaningful ceilings in prior markets.

Tips Showing Clear Signs Of Bullish DivergenceTreasury Inflation Protected Securities are showing very clear divergence on the 2 week scale. Divergence of such are some of the most powerful signals that one can get especially on such a wide timeframe generally mean a shift in dynamics for quiet sometime. More so when concluding in bonds. As bonds generally tied to arrange of macro economic factors and TIPS being tied closely to inflation, CPI and rates. This means that the possibility of inflation remaining at Two percent is very low. As for TIP's to remain bearish
A) Inflation has to be coming down.
B) Rates are going up despite inflation moving higher. (Negatively Affecting Prior Bond Purchased as a Current Yield Would be Worth More so bonds purchased in the index prior to rate increase would be depreciating until rates decrease.)
Currently the economy is already showing signs of a hard landing. Soon the US will have to start to lower rates due to the economic slow down. This coincides with inflation coming down or rate cuts happening as a result of a significant decrease in inflation and to stop deflationary period.
However, this chart suggest that with the economy slowing down that inflation at any moment could still propel itself back up. Especially at the sign of rate cuts. More or less suggesting that it could be a little while yet before Rate Cuts happen because of inflation wanting to remain stagnant.

QQQ still very elevated when compared to the TIPThe NASDAQ:QQQ typically trades with the AMEX:TIP over time, as the TIP represents real yields. With the TIP ETF falling, it would suggest the QQQ should be falling too, but that relationship has broken down over the past several weeks, suggesting one is likely wrong.

TIP off... Just want to show an anomaly observed here... sort of a tip off on what is most likely to happen.
You see, I read Russell Napier's Anatomy of the Bear back in 2009 (not easy to get it as it is out of print!), and he describes TIP as one of the/a leading indicator ahead of the equity market.
Superimposed on the TIP daily chart is the SPY (blue line), NASDAQ (cyan line).
You can see that it does lead the SPY and NASDAQ.
However, there is a deviation from the pattern since two weeks ago. TIP has been falling hard, and the technical indicators are all bearish no doubt; but the SPY has been cranking upwards, furthermore so the NASDAQ.
So, here is the deal... either TIP rockets back up, or the equity markets dive down.
Which would it be, you think???

TIP off?Overlayed the TIP a chart with SPY (blue line). Quite clear that TIP (amongst JNK/HYG and even copper) precedes the index.
Given all previous analyses and outlook, what we would like to see is that TIP break out and above its trend line resistance, as does its VolDiv. When this happens, can expect a bullish advancement.
MACD has not yet turned to crossover, but VolDiv is already giving us a heads up tip off! < Pun not intended >

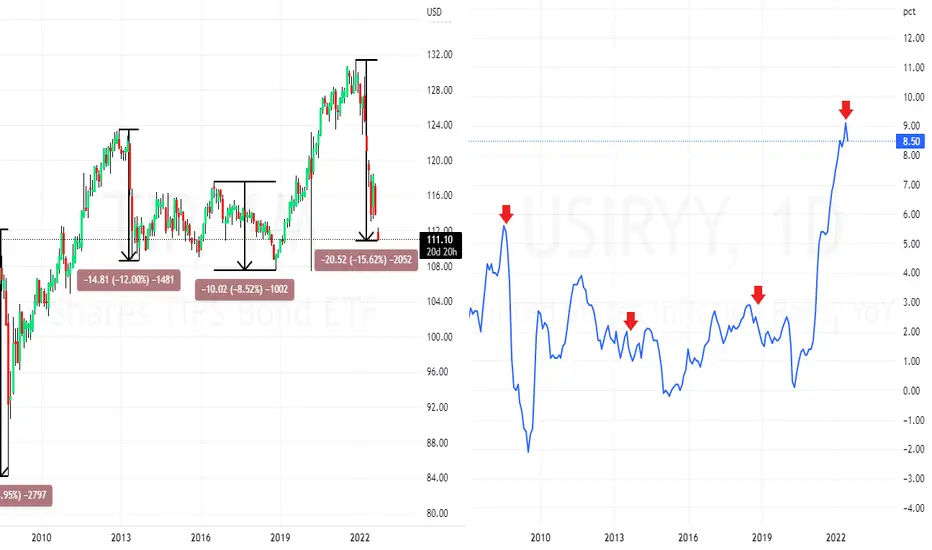
Inflation Protected Treasuries in free fallTips continuing to fall off a cliff. Almost as bad as gfc 2008.
Silent deflation.
#fintwit

Simple comparison between TIP and SPY - ominous lookingA simple comparison between TIP and SPY line charts. Had always known that TIP is one of the leading indicator for the S&P500 index (and ETF is SPY). Previous heads up shown with the lag denoted by the white boxes.
Key takeaway here is that TIP had went past the last low, and is pushing down lower, while the SPY is hovering and IF it is to keep the co-related relationship, it does suggest a lower low for the SPY!
A similar time previously occured in September 2018; and twice in 2022 - January & March
So... how do you think this September-October would turn out?

Impact of TIPS on inflationHello friends.
There is an interesting correlation between the TIP ETF and inflation. TIPS stands for Treasury Inflation-Protected Security. These are fixed-income assets with a built-in hedge against inflation, so investors buy TIP when they expect high inflation and sell TIP when they expect low inflation. There is a clear lag between the movements in the price of TIP and the ultimate movement of CPI inflation for the USA.
Every time there has been a substantial crash in the price of TIP, there has subsequently been a period of deflation where the YoY CPI fell substantially.
TIP has fallen an impressive 15% from its high, a crash second only to the global financial crisis. Because of this, we can expect a substantial amount of deflation in the coming years.
Our forecast for the annual CPI reading at the end of 2023: 6.0% or a bit lower
Note that this relationship works the other way as well. If TIP rises, we should expect higher inflation in the near future. TIP actually predicted this massive rally in inflation by rising dramatically long before the CPI did.
TIP IS WAVE 2 OF WAVE 3?
if price cannot break b , he going to c
wave 3 is not complete so i think we still correction in wave 3

Elliot Wave Monthly Count on Bond RatesIt appears that Bonds failed and reversed at a exact 0.618 extension of the bull run since 2008 and reversed sharply which is characteristic of a truncated C Wave suggesting we are headed much lower in prices and consequently much higher in yields. (Possibly all the way back to 2008 origination.)
Note I have labelled this as an ABC move and not an impulsive move as the alternate count is we are in wave 4 but as Wave 4 has already intruded into the top of Wave 1 ( Alternate to A) so this is presently discounted.
Bonds should find support in the 122.00 area leading to a rally to 126-127.60 area and subsequent stock market rally but it will be short lived as the next move down is expected to take bonds to 116.65 and stock markets down with it.

Will Inflation Eat Stocks?RINF is an exchange-traded fund that tries to price inflation expectations. TIP is an ETF that tries to hedge against inflation. While both of these have flattened (or are falling), the CPI keeps rising. Could it be that even stocks won't be able to outrun inflation in 2022?

Define "Transitory"The TIP / IEF ratio (reflecting relative strength of Treasury Inflation-Protected securities against T Bonds), having broken thru a declining long-term trend early in 2021, has now advanced to record an 8 year high. The Fed inflation narrative does not appear to be satisfying bond market participants.


Ominous signs from the Leading Indicators panelLooking across the panel of leading indicators, it is starting to look as if something ominous is almost completed in building up and about to pop...
The JNK High Yield bond ETF is hitting a resistance;
The IWM iShares Russell 2000 ETF is in a bind, unable to break out as MACD is crossing into bearish region;
The TIPS Bond ETF is falling over;
The VIX is about to burst in break out, MACD bullish divergence supporting;
The DJ Trans had already brokedn down closing at a 6 month low, and MACD is already bearish;
The Value Geometric line is following suit soon;
The TLT bond ETF just attempted to break out, and should see another move upwards in the weeks coming; and
The Copper futures prices is not sustaining any bullishness and about to breka down, MACD leading the way.
Overall, the next two weeks will be volatile, and decisively down at some point.
Heads up!

Inflation TradeIn the chart below you have the TIP and IEF the IEF ratio. IEF is Ishares 7-10 year treasury bond ETF and TIP is the TIPs bond etf. On the right side of the chart you have the 10 year inflation breakeven. Now looking at the two you can see that they track pretty closely. Now generally the IEF 7-10 year has a very similar duration to that of the TIP etf.
Some people are wondering how to play the inflation hedge as with some of the largest tech stocks P/E multiple compression could pose an issue to high P/E ratio trading stocks. What does this mean, and what is multiple compression. Well what happens as inflation rises that inflation starts to be built into P/E multiples, and as that happens you start to get compression of those P/E multiples this can pose a massive risk to equity holders.
So my thesis would be you could short IEF, and be long TIP. This is something to look into, and I believe that spread that you can see below is going to widen tremendously. So it is something to watch out for, and a trade you might want to consider setting up.

Gold and real rates divergenceTVC:GOLD and AMEX:TIP use to move in tandem. One of them likely to cach up with the other.

TIPS vs Gold Price suggests Gold is undervaluedGold has a strong correlation with inflation protected T Bonds. Recently, gold has underperformed - most likely the gap will be closed soon. Either TIPS fall, or gold goes up.

TIPS broke out of an ascending triangleReal rates are getting lower, TIP is at all time high after it broke out of an ascending triangle.

Watching GOLD for possible short ideaIm waiting to see if TIPS turn weak and DXY gain strengh. Then for gold to form a Resistance. But for now GOLD is still Bullish but im being patient

Inflation watchKeep an eye on the relative strength of TIPS vs IEF as a measure of inflation expectations. Watching both real and nominal interest rates can be helpful in assessing future prospects for commodities and other real assets.

TIPWe had this massive reversal on Friday while gold was selling off. TIP´s and gold move petty much in line. Just another factor why I see a bounce in Gold and Silver.
