$TMF means Too Much FunIf it wasnt for politics, we would have already had a rate cut. The cut will come and when it comes, it might not be 25 bps. It may be much more because we need to catch up and the economy will be in the gutter. Enjoy the melt up but this thing will go parabolic in the next 2 years.
Key stats
About Direxion Daily 20-Yr Treasury Bull 3x Shrs
Home page
Inception date
Apr 16, 2009
Structure
Open-Ended Fund
Replication method
Synthetic
Dividend treatment
Distributes
Distribution tax treatment
Ordinary income
Income tax type
Capital Gains
Max ST capital gains rate
39.60%
Max LT capital gains rate
20.00%
Primary advisor
Rafferty Asset Management LLC
Distributor
Foreside Fund Services LLC
TMF provides daily leveraged (3x) exposure to the ICE U.S. Treasury 20+ Year Bond Index. Using a combination of swaps and futures, TMF gives investors 3x exposure to daily moves in T-bonds with more than 20 years left to maturity. The daily reset means investors shouldn't expect the leverage factor to hold constant over investment horizons greater than one day. In short, the fund is a valid option for tactical positioning/hedging against rising interest rates, but it's important to keep in mind that the 3x leverage results in greater impact from the effects of compounding. As a levered product, TMF is not a buy-and-hold ETF, it's a short-term tactical instrument. Prior to May 2, 2016, TMF tracked the NYSE 20+ Year Treasury Bond Index. The change had minimal impact on investors exposure.
Related funds
Classification
What's in the fund
Exposure type
ETF
Cash
Stock breakdown by region
Top 10 holdings
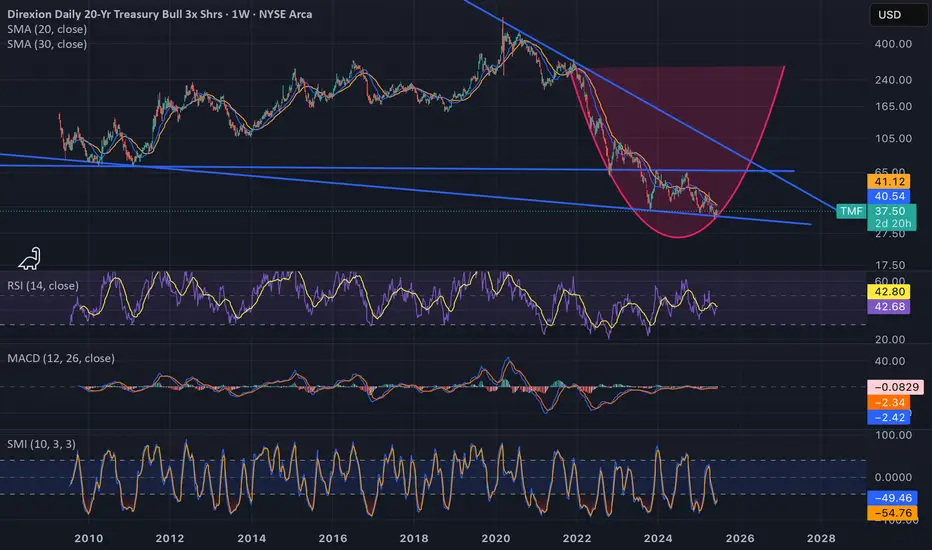
TMF to break out over next 2-3 monthsTMF to break out over next 2-3 months. The Bond Market is consolidating and something is about to break forcing Powell into a forced / Crisis Pivot. The Bond Market is the true Oracle of Delphi.

TMF in Buy ZoneMy trading plan is very simple.
I buy or sell when at three of these events happen:
* Price tags the top or bottom of parallel channel zones
* Money flow spikes beyond it's Bollinger Bands
* Stochastic Momentum Index (SMI) at near oversold overbought level
* Price at Fibonacci levels
So...
Here's

Opening (IRA): TMF May 17th 39 Covered Call... for a 38.06 debit.
Comments: Along with TLT, one of the only red things on my ETF board. Doing a starter position here, selling the -75 delta call against shares to emulate the delta metrics of a 25 delta short put, but with the built-in defense of the short call.
Metrics:
Buying Power Effe

Opening (IRA): TMF May 16th 37 Covered Call... for a 36.05 debit.
Comments: Adding at strikes/break evens better than what I currently have on, selling the -75 delta call against shares to emulate the delta metrics of a 25 delta short put, but with the built-in defense of the short call.
Metrics:
Buying Power Effect/Break Even: 36.05/sha

Opening (IRA): TMF March 28th 36 Covered Call... for a 35.08 debit.
Comments: Selling the -75 delta call against shares on weakness to emulate the delta metrics of a 25 delta short put, but with the built-in defense of the short call.
Metrics:
Buying Power Effect/Break Even: 35.08
Max Profit: .92
ROC at Max: 2.62%
50% Max: .46
ROC at 50% M

Opening (IRA): TMF March 21st 36 Covered Call... for a 34.85 debit.
Comments: Starter position. Selling the -75 delta call against shares to emulate the delta metrics of a 25 delta short put, but with the built-in defense of the short call.
Metrics:
Buying Power Effect/Break Even: 34.85
Max Profit: 1.15
ROC at Max: 3.30%
50% Max: .58
ROC

Opening (IRA): TMF Feb 28th 35 Covered Call... for a 33.98 debit.
Comments: High IVR/IV at 40.7/44.2, which is no surprise, since this is a bullish 3 x leveraged 20 year paper exchange-traded fund. It does have a dividend that pays out quarterly in March, June, September, and December (annualized yield of 4.71%).
Selling the -75 delta c

Taking another LONG ride at 58.61 with TMF (oversold)It worked well last time (+11.9% in 7 trading days) and even better the time after that when I FORGOT to trade it - see my last idea for TMF for how that went. So I went long at 58.61 this morning. I'm not missing this train again.
I don't think rates are going up any time soon and neither does a

TMF Swing Trade and Long-Term HoldConfluence 1:
On the 4H Chart, TMF has been respecting the upper channel. Back on 8/1, TMF broke out of the resistance trendline and then re-tested it on 8/8. That trendline is now acting as support which we recently bounced off of.
Confluence 2:
On 9/24, TMF touched into the fair value gap hig

See all ideas
Summarizing what the indicators are suggesting.
Oscillators
Neutral
SellBuy
Strong sellStrong buy
Strong sellSellNeutralBuyStrong buy
Oscillators
Neutral
SellBuy
Strong sellStrong buy
Strong sellSellNeutralBuyStrong buy
Summary
Neutral
SellBuy
Strong sellStrong buy
Strong sellSellNeutralBuyStrong buy
Summary
Neutral
SellBuy
Strong sellStrong buy
Strong sellSellNeutralBuyStrong buy
Summary
Neutral
SellBuy
Strong sellStrong buy
Strong sellSellNeutralBuyStrong buy
Moving Averages
Neutral
SellBuy
Strong sellStrong buy
Strong sellSellNeutralBuyStrong buy
Moving Averages
Neutral
SellBuy
Strong sellStrong buy
Strong sellSellNeutralBuyStrong buy
Displays a symbol's price movements over previous years to identify recurring trends.
Frequently Asked Questions
An exchange-traded fund (ETF) is a collection of assets (stocks, bonds, commodities, etc.) that track an underlying index and can be bought on an exchange like individual stocks.
TMF trades at 38.99 USD today, its price has risen 4.20% in the past 24 hours. Track more dynamics on TMF price chart.
TMF net asset value is 38.98 today — it's fallen 1.37% over the past month. NAV represents the total value of the fund's assets less liabilities and serves as a gauge of the fund's performance.
TMF assets under management is 5.04 B USD. AUM is an important metric as it reflects the fund's size and can serve as a gauge of how successful the fund is in attracting investors, which, in its turn, can influence decision-making.
TMF price has risen by 1.93% over the last month, and its yearly performance shows a −27.93% decrease. See more dynamics on TMF price chart.
NAV returns, another gauge of an ETF dynamics, have fallen by −1.37% over the last month, showed a −0.28% decrease in three-month performance and has decreased by −23.82% in a year.
NAV returns, another gauge of an ETF dynamics, have fallen by −1.37% over the last month, showed a −0.28% decrease in three-month performance and has decreased by −23.82% in a year.
TMF fund flows account for 647.81 M USD (1 year). Many traders use this metric to get insight into investors' sentiment and evaluate whether it's time to buy or sell the fund.
Since ETFs work like an individual stock, they can be bought and sold on exchanges (e.g. NASDAQ, NYSE, EURONEXT). As it happens with stocks, you need to select a brokerage to access trading. Explore our list of available brokers to find the one to help execute your strategies. Don't forget to do your research before getting to trading. Explore ETFs metrics in our ETF screener to find a reliable opportunity.
TMF invests in funds. See more details in our Analysis section.
TMF expense ratio is 0.91%. It's an important metric for helping traders understand the fund's operating costs relative to assets and how expensive it would be to hold the fund.
Yes, TMF is a leveraged ETF, meaning it uses borrowings or financial derivatives to magnify the performance of the underlying assets or index it follows.
In some ways, ETFs are safe investments, but in a broader sense, they're not safer than any other asset, so it's crucial to analyze a fund before investing. But if your research gives a vague answer, you can always refer to technical analysis.
Today, TMF technical analysis shows the buy rating and its 1-week rating is neutral. Since market conditions are prone to changes, it's worth looking a bit further into the future — according to the 1-month rating TMF shows the sell signal. See more of TMF technicals for a more comprehensive analysis.
Today, TMF technical analysis shows the buy rating and its 1-week rating is neutral. Since market conditions are prone to changes, it's worth looking a bit further into the future — according to the 1-month rating TMF shows the sell signal. See more of TMF technicals for a more comprehensive analysis.
Yes, TMF pays dividends to its holders with the dividend yield of 4.13%.
TMF trades at a premium (0.02%).
Premium/discount to NAV expresses the difference between the ETF’s price and its NAV value. A positive percentage indicates a premium, meaning the ETF trades at a higher price than the calculated NAV. Conversely, a negative percentage indicates a discount, suggesting the ETF trades at a lower price than NAV.
Premium/discount to NAV expresses the difference between the ETF’s price and its NAV value. A positive percentage indicates a premium, meaning the ETF trades at a higher price than the calculated NAV. Conversely, a negative percentage indicates a discount, suggesting the ETF trades at a lower price than NAV.
TMF shares are issued by Rafferty Asset Management LLC
TMF follows the US Treasury 20+ Year Index. ETFs usually track some benchmark seeking to replicate its performance and guide asset selection and objectives.
The fund started trading on Apr 16, 2009.
The fund's management style is passive, meaning it's aiming to replicate the performance of the underlying index by holding assets in the same proportions as the index. The goal is to match the index's returns.