$TMF means Too Much FunIf it wasnt for politics, we would have already had a rate cut. The cut will come and when it comes, it might not be 25 bps. It may be much more because we need to catch up and the economy will be in the gutter. Enjoy the melt up but this thing will go parabolic in the next 2 years.
TMF trade ideas
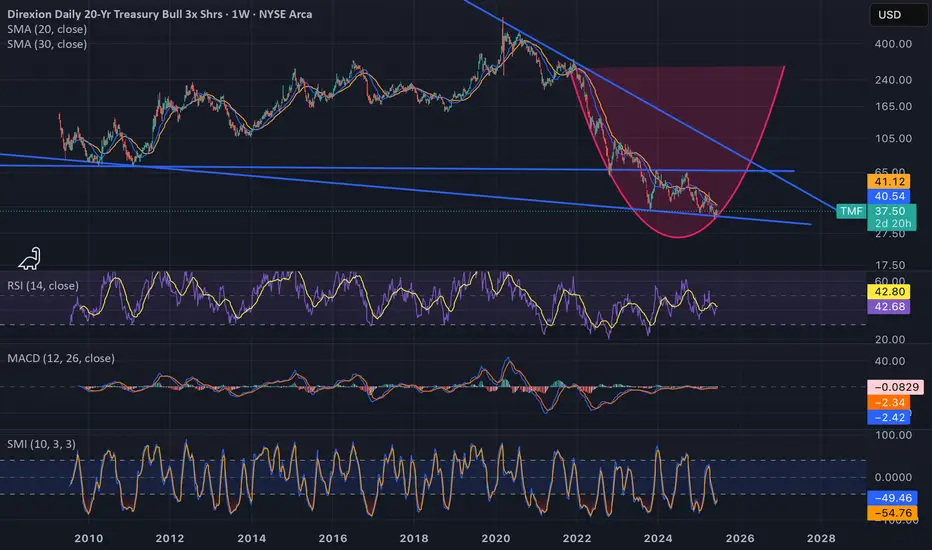
TMF to break out over next 2-3 monthsTMF to break out over next 2-3 months. The Bond Market is consolidating and something is about to break forcing Powell into a forced / Crisis Pivot. The Bond Market is the true Oracle of Delphi.

TMF in Buy ZoneMy trading plan is very simple.
I buy or sell when at three of these events happen:
* Price tags the top or bottom of parallel channel zones
* Money flow spikes beyond it's Bollinger Bands
* Stochastic Momentum Index (SMI) at near oversold overbought level
* Price at Fibonacci levels
So...
Here's why I'm picking this symbol to do the thing.
Price in buying zone at bottom of channels
Stochastic Momentum Index (SMI) at oversold level
Money flow momentum is spiked negative and under at bottom of Bollinger Band
Entry at $36.66
Target is upper channel around $44

Opening (IRA): TMF May 17th 39 Covered Call... for a 38.06 debit.
Comments: Along with TLT, one of the only red things on my ETF board. Doing a starter position here, selling the -75 delta call against shares to emulate the delta metrics of a 25 delta short put, but with the built-in defense of the short call.
Metrics:
Buying Power Effect/Break Even: 38.06/share
Max Profit: .94
ROC at Max: 2.47%
50% Max: .47
ROC at 50% Max: 1.24%
Will generally look to take profit at 50% max, add at intervals if I can get in at strikes/break evens better than what I currently have on, and/or roll out the short call at 50% max.

Opening (IRA): TMF May 16th 37 Covered Call... for a 36.05 debit.
Comments: Adding at strikes/break evens better than what I currently have on, selling the -75 delta call against shares to emulate the delta metrics of a 25 delta short put, but with the built-in defense of the short call.
Metrics:
Buying Power Effect/Break Even: 36.05/share
Max Profit: .95
ROC at Max: 2.64%
50% Max: .48
ROC at 50% Max: 1.32%
Will generally look to take profit at 50% max, look to add at intervals if I can get in at a break even better than what I currently have on, and/or roll out short call when that aspect hits 50% max.

Opening (IRA): TMF March 28th 36 Covered Call... for a 35.08 debit.
Comments: Selling the -75 delta call against shares on weakness to emulate the delta metrics of a 25 delta short put, but with the built-in defense of the short call.
Metrics:
Buying Power Effect/Break Even: 35.08
Max Profit: .92
ROC at Max: 2.62%
50% Max: .46
ROC at 50% Max: 1.31%
Will generally look to take profit at 50% max, add at intervals if I can get in at strikes/break evens better than what I currently have, and/or roll out the short call on approaching worthless if my take profit is not hit.

Opening (IRA): TMF March 21st 36 Covered Call... for a 34.85 debit.
Comments: Starter position. Selling the -75 delta call against shares to emulate the delta metrics of a 25 delta short put, but with the built-in defense of the short call.
Metrics:
Buying Power Effect/Break Even: 34.85
Max Profit: 1.15
ROC at Max: 3.30%
50% Max: .58
ROC at 50% Max: 1.65%
Will generally look to take profit at 50% max, add at intervals, assuming I can get in at strikes/break evens better than what I currently have on, and/or roll out the short call if my take profit is not hit.

Opening (IRA): TMF Feb 28th 35 Covered Call... for a 33.98 debit.
Comments: High IVR/IV at 40.7/44.2, which is no surprise, since this is a bullish 3 x leveraged 20 year paper exchange-traded fund. It does have a dividend that pays out quarterly in March, June, September, and December (annualized yield of 4.71%).
Selling the -75 delta call against shares to emulate the delta metrics of a 25 delta short put, but with the built-in defense of the short call. Using the February 28th expiry to keep things in that 45 DTE wheelhouse and will look to add at intervals, assuming I can get in at strikes/break evens better than what I currently have on.
Metrics:
Buying Power Effect/Break Even: 33.98/share
Max Profit: 1.02
ROC at Max: 3.00%
50% Max: .51
ROC at 50% Max: 1.50%
Will generally look to take profit at 50% max, roll in-profit short call out to reduce my break even.

Taking another LONG ride at 58.61 with TMF (oversold)It worked well last time (+11.9% in 7 trading days) and even better the time after that when I FORGOT to trade it - see my last idea for TMF for how that went. So I went long at 58.61 this morning. I'm not missing this train again.
I don't think rates are going up any time soon and neither does anyone else. I think this is a buy the rumor sell the news pullback that is part of a larger uptrend as part of this rate normalization regime by the Fed.
I also think we are getting back to a normal world where the bond market is not so highly correlated with stocks. Given that I think the market may take a little rest this week, it seems like a good time to get in on TMF. Will add more if it stays oversold and will sell lots when they become profitable.
As always, this is market edutainment and a play by play of my trading, not investment advice, and should not be taken as such. Trade at your own risk.

TMF Swing Trade and Long-Term HoldConfluence 1:
On the 4H Chart, TMF has been respecting the upper channel. Back on 8/1, TMF broke out of the resistance trendline and then re-tested it on 8/8. That trendline is now acting as support which we recently bounced off of.
Confluence 2:
On 9/24, TMF touched into the fair value gap highlighted in gray. From there, we showed some signs of bullishness. This is where I initiated a starter position in TMF.
Confluence 3:
On 9/26, we came back to sweep liquidity (stop out initial longs) and tap into the order block (the red shooting star candle before the big green candle) on 9/3. On the Daily chart, we see the trendline was not broken (did not close below, only wicked through)
Confluence 4:
RSI also hit 25 (<30) on the 4H on 9/24, and a bullish MACD crossover occurred on 9/26.
Take Profit :
At the top of the channel AKA upper trendline which is currently acting as resistance. I plan to trim some of my position and begin to sell covered calls to generate income.
Stop Loss :
A close below the lower trendline in the low 50s. If the middle support trendline is broken, I will add to my position. If you are looking to swing trade this (not long-term hold), I would exit if we close below this line at around 56-57.
From a macro standpoint - there is economic and geopolitical uncertainty due to Middle East tensions. There are several factors that could put us into a recession, so TMF, TLT, or BND are good holds to hedge a equity-heavy portfolio.
TMF is 3x leveraged so please do your own due diligence before trading this!
My positions:
[ ADDED TODAY ] 100 shares of TMF @ 59.70
100 shares TMF @ 57.61
100 shares TLT @ 98.61
Sold 2 Cash-Secured Puts for 10/18 @ 57
This is in total (including CSP collateral) makes up roughly 5-10% of my portfolio.

TMF - WILL IT HOLD?I don't know. Maybe. If trend does reverse it will likely be for a short period of time, I'd be looking to buy. Buying here is not 10/10 trade.

Long TMF @ 46.01Bought at the close. Same concept as my other trades but using a 3x leveraged ETF to trade an oversold bond market. Will hold until overbought and profitable and will add to the position as long as it is oversold. Will add details on the track record for this security later.

This thing is gonna rocket 300% by the end of this year!Bonds are sniffing out deflation and falling rates, which'll happen when Asia (China and Japan) start devaluing and selling things off for dollars (incl. treasuries). This will be a bull bond market soon. I don't quite see this taking off yet, so we could retest the breakout again, but could launch from here.
I like building a position in this, but I'll be buying calls in this soon if this retests. I see those calls returning 20x!! I'll update that when and IF it happens. For now, start scaling in this badboy! Check out my NASDAQ:TLT thread for the darkpool buying on $TMF.

TMF long trade setup 3X Bullish TreasuriesTMF on the 4H chart is set up at the bottom descending support trendline of a symmetrical
triangle in the approach to the apex. Price appears ready to reach for the upper descending
resistance trend line and the Echo Indicator ( Lux Algo ) makes that forecast. Current
ambiguities in a rate cut soon upcoming will make values of Treasuries a complicated matter.
I am taking a long trade targeting 54 with a stop loss at 50 in consideration of the triangle
pattern. I have existing positions in TLT.

Upside incomingRsi bounced off rsi ma headed back to $64 IMO. Usually a bullish sign when they fail to cross.

Up-date: direction clearification on interest ratesThere is an interesting relationship between VIX and Treasuries in an inverse movement to each other as I published in August 2023 already. It seems there will be a touching point very soon, which means interest rates will rise again (for what ever reason ! ) and VIX will go up. I'm looking for the VIX low towards end of November, i.e. peaking of the S&P 500 and turning in a temporary pull-back. Summary: we will have interesting possibilities to take positions short and long in Treasury-ETFs, VIX and S&P500. Good luck for you all............

Impulse correction ?? - TMF pump 🚀📣 Hello everyone!
I believe that in the next 3-5 months we can get a correction (growth - inverse chart) on TMF.
The US 20-year yield of 5.388% on October 23 could be the medium-term maximum, or we are already very close to it. To do this, it is necessary to observe more, since the trend on the same TMF chart has not yet been broken. Be careful and keep a close eye on this.
Target:
🎯 TP1 - $6.59
🎯 TP2 - $7.78
🎯 TP3 - 10$
Goodbye!

Closer Look at TMF... God it has me shaking in my bootsDiamond hands unit! I posted a zoomed out version earlier but I don't think we will get back above 30s let along 50. My target is 15-20, $24 would make me happy and I'm not sure if I will even put take profits above. Maybe 1 small position at 27 and 29

More pain ahead for bond traders is a risk, but long-term bull..At the time of writing it is crucial for buyers to hold the 5.5 level, if not, I see a possibility for the price to move inside 4.2-5,2 range and consolidate there. I don't think it will be a long process in terms of time.
Fundamentally though I have a bullish view and started to slowly accumulate position with an investment time horizon at least 1 year I foresee, maybe more. If it happens faster than in the near future the interest rates in the US will be cut dramatically, thus causing some serious black swan event.
Time will tell, on the upside I see around 20-30 level as a possible long-term target, but bond bulls might definitely get wrecked before reaching a final bottom in price. Practically speaking FED hawkish cycle is in the topping process, thus yields, especially on long end can increase to meet the fed fund rate (which is at the time of writing is at 5,5%) causing the bond price to fall.

TMF Blow Off Bottom, We need diamond hands more than ever!!!This could be the all time low of TMF as with TLT that just hit $86 it looks like.
If TLT hits my target of $124 conservatively TMF will it $19

Direction clearification on interest ratesA lot of traders are positioned on the long side in treasuries, betting on FED to reduce rates soon (extreme volumes of call options in the market) - to me a total illusion ! ! !
1. We do not have to hope in trading, because it ends up in losses, rather listening to the FED-speak carefully. They still give hawkish remarks and the financial enviroment from the FED's perspective does not favour lower rates at all.
2. Looking on below chart one can see that VIX and 20yr treasuries are moving in inverted direction in their trends. Treasuries gave, like VIX, a clear trend reversal thus confirming each other trends.
3. The inverted interest spread (short interest rate versus long interest rate) had a trend reversal as well toward the zero line. At the time of crossing the zero line, people will talk about recession in the US while now, nobody factors in that possibility any more.
Long story short: Stock market is in trouble, treasuries - especially long term treasuries - will lose value much more than anticipated, volatility will increase in bonds as well as in the S&P500.

TMF ( 3X Treasuries)beatdown completed reversal underway LONGOn the one-hour chart, TMF a triple ETF of long-expiration treasuries has finally
completed its downtrend or ten days given more bearish momentum with the federal
debt downgrade of creditworthiness as well as the rise of BRICS as a reserve currency.
Three indicators show bullish divergence with a MACD cross under the histogram. The
30 minute RS line rising before the 2 hr RS line reacts and importantly a mass index
signal rising into the reversal line and then a drop. While none of this is a Holy Grail,
I am confident that the bias here is bullish. I will trade long if you are interested in
the stop loss and targets let me know. If you would lke my idea of an options setup, let
me know as well. If this idea is helpful, please like and subscribe. Trade well !

TMF Bull Treasuries Triple Leveraged LONGTMF as shown on a 15 minute chart shows TMF in consolidation at the beginning of the weeks
followed by a downtrend when the fed news of the rate hike came out. Today the general
market dropped after some federal financial data came out and a treasury auction was a dud
with little buyers confounded by Bank of Japan actions inconsistent with the path of the US Fed.
The mass index indicator has signaled a reversal as the signal rose above the reversal zone
and then dropped below the zone thus triggering. The Relative Trend Index documents
the end of the downtrend with the signal line nearly returning above zero. Overall, I think
this leveraged ETF overreacted to the federal news and the catalyst from Japan. I believe
this to be an good point to enter long using the pivot low as the stop loss. Targets are 7.20
just below the mean anchored VWAP and 7.45 just below the lower boundary of the high
volume area of the intermediate term volume profile. This offers modest potential profile
for a relatively low risk.
