TPOR Triple leveraged Transportation ETF SWING LONGFundamentally, the stabilization of fuel prices helps push things down the road.
A possible rail strike if no averted by Congressionaly action will cause a big macro effect.
TPOR was downtrending into the end of September then reversed starting a trend back up.
I see this as a good long swing buy
Key stats
About Direxion Daily Transportation Bull 3X Shares
Home page
Inception date
May 3, 2017
Structure
Open-Ended Fund
Replication method
Synthetic
Dividend treatment
Distributes
Distribution tax treatment
Ordinary income
Income tax type
Capital Gains
Max ST capital gains rate
39.60%
Max LT capital gains rate
20.00%
Primary advisor
Rafferty Asset Management LLC
Distributor
Foreside Fund Services LLC
TPOR provides 3x leveraged exposure to the S&P Transportation Select Industry FMC Capped Index, a subset of the S&P Total Market Index that focuses on US transportation companies of all market capitalizations. Holdings are weighted by market-cap, subject to certain capping requirements. A maximum weight of 22.5% of the fund can be allocated to one company, and the aggregate weight of all issuers that individually exceed 4.5% of the index weight are capped at a maximum of 45%. The underlying index rebalances quarterly. As a geared product with daily resets, TPOR is designed as a short-term trading tool and not a long-term investment vehicle. Long-term returns could materially differ from those of the underlying index due to daily compounding. Prior to August 1, 2022, the fund tracked the Dow Jones Transportation Average Index.
Related funds
Classification
What's in the fund
Exposure type
Transportation
Cash
Stock breakdown by region
Top 10 holdings

TPOR - possible entry timeBased on few things:
Oversold territory
Momentum increasing
Vixfix bottomed
Also, got signal on market timer strategy!!

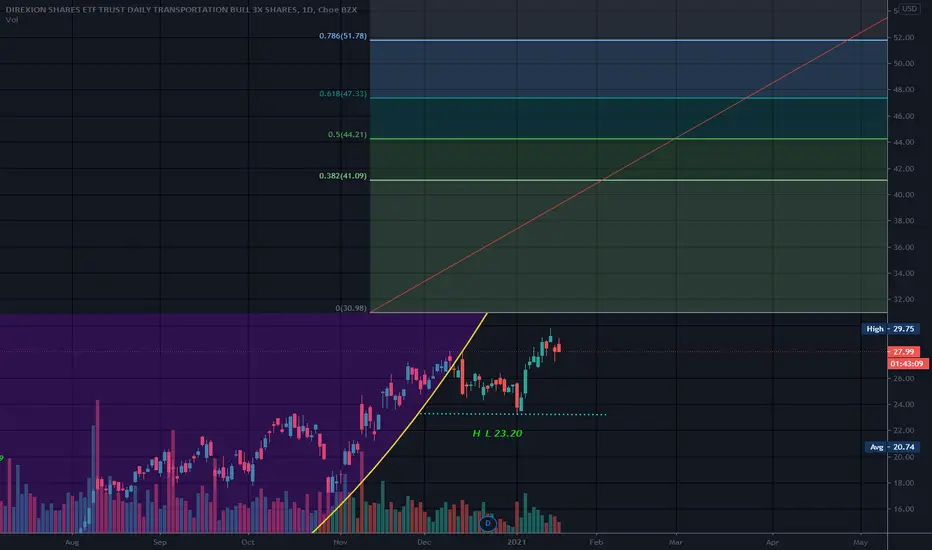
Cup and HandleLEVERAGED..
Can be risky. Can make cash quick but can lose it very fast as well if the market turns or has a bad day
Using cup depth, some folks calculate targets using fib levels. 100% would be 57.44. Targets 1 are usually the 0.382, .618 and .786...Targets above this are usually designated as

See all ideas
Summarizing what the indicators are suggesting.
Oscillators
Neutral
SellBuy
Strong sellStrong buy
Strong sellSellNeutralBuyStrong buy
Oscillators
Neutral
SellBuy
Strong sellStrong buy
Strong sellSellNeutralBuyStrong buy
Summary
Neutral
SellBuy
Strong sellStrong buy
Strong sellSellNeutralBuyStrong buy
Summary
Neutral
SellBuy
Strong sellStrong buy
Strong sellSellNeutralBuyStrong buy
Summary
Neutral
SellBuy
Strong sellStrong buy
Strong sellSellNeutralBuyStrong buy
Moving Averages
Neutral
SellBuy
Strong sellStrong buy
Strong sellSellNeutralBuyStrong buy
Moving Averages
Neutral
SellBuy
Strong sellStrong buy
Strong sellSellNeutralBuyStrong buy
Displays a symbol's price movements over previous years to identify recurring trends.
Frequently Asked Questions
An exchange-traded fund (ETF) is a collection of assets (stocks, bonds, commodities, etc.) that track an underlying index and can be bought on an exchange like individual stocks.
TPOR trades at 28.15 USD today, its price has risen 3.00% in the past 24 hours. Track more dynamics on TPOR price chart.
TPOR net asset value is 28.18 today — it's risen 13.12% over the past month. NAV represents the total value of the fund's assets less liabilities and serves as a gauge of the fund's performance.
TPOR assets under management is 16.37 M USD. AUM is an important metric as it reflects the fund's size and can serve as a gauge of how successful the fund is in attracting investors, which, in its turn, can influence decision-making.
TPOR price has risen by 14.29% over the last month, and its yearly performance shows a 1.08% increase. See more dynamics on TPOR price chart.
NAV returns, another gauge of an ETF dynamics, have risen by 13.12% over the last month, showed a 58.97% increase in three-month performance and has increased by 1.83% in a year.
NAV returns, another gauge of an ETF dynamics, have risen by 13.12% over the last month, showed a 58.97% increase in three-month performance and has increased by 1.83% in a year.
TPOR fund flows account for −4.72 M USD (1 year). Many traders use this metric to get insight into investors' sentiment and evaluate whether it's time to buy or sell the fund.
Since ETFs work like an individual stock, they can be bought and sold on exchanges (e.g. NASDAQ, NYSE, EURONEXT). As it happens with stocks, you need to select a brokerage to access trading. Explore our list of available brokers to find the one to help execute your strategies. Don't forget to do your research before getting to trading. Explore ETFs metrics in our ETF screener to find a reliable opportunity.
TPOR invests in stocks. See more details in our Analysis section.
TPOR expense ratio is 0.97%. It's an important metric for helping traders understand the fund's operating costs relative to assets and how expensive it would be to hold the fund.
Yes, TPOR is a leveraged ETF, meaning it uses borrowings or financial derivatives to magnify the performance of the underlying assets or index it follows.
In some ways, ETFs are safe investments, but in a broader sense, they're not safer than any other asset, so it's crucial to analyze a fund before investing. But if your research gives a vague answer, you can always refer to technical analysis.
Today, TPOR technical analysis shows the buy rating and its 1-week rating is neutral. Since market conditions are prone to changes, it's worth looking a bit further into the future — according to the 1-month rating TPOR shows the sell signal. See more of TPOR technicals for a more comprehensive analysis.
Today, TPOR technical analysis shows the buy rating and its 1-week rating is neutral. Since market conditions are prone to changes, it's worth looking a bit further into the future — according to the 1-month rating TPOR shows the sell signal. See more of TPOR technicals for a more comprehensive analysis.
Yes, TPOR pays dividends to its holders with the dividend yield of 1.75%.
TPOR trades at a premium (0.11%).
Premium/discount to NAV expresses the difference between the ETF’s price and its NAV value. A positive percentage indicates a premium, meaning the ETF trades at a higher price than the calculated NAV. Conversely, a negative percentage indicates a discount, suggesting the ETF trades at a lower price than NAV.
Premium/discount to NAV expresses the difference between the ETF’s price and its NAV value. A positive percentage indicates a premium, meaning the ETF trades at a higher price than the calculated NAV. Conversely, a negative percentage indicates a discount, suggesting the ETF trades at a lower price than NAV.
TPOR shares are issued by Rafferty Asset Management LLC
TPOR follows the S&P Transportation Select Industry FMC Capped Index. ETFs usually track some benchmark seeking to replicate its performance and guide asset selection and objectives.
The fund started trading on May 3, 2017.
The fund's management style is passive, meaning it's aiming to replicate the performance of the underlying index by holding assets in the same proportions as the index. The goal is to match the index's returns.