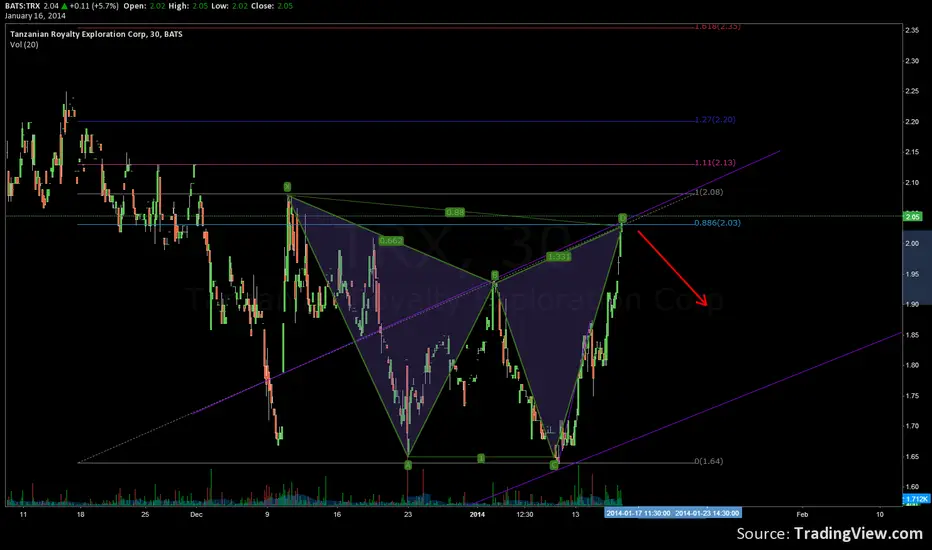
Possible scalp play....TRX in an odd 3 drive to a bottom patternA trade plan on pure technical indicators.
Research this one before trading it ... fundamentals are not strong.
It's highly speculative.
That said:
Back to the pattern...
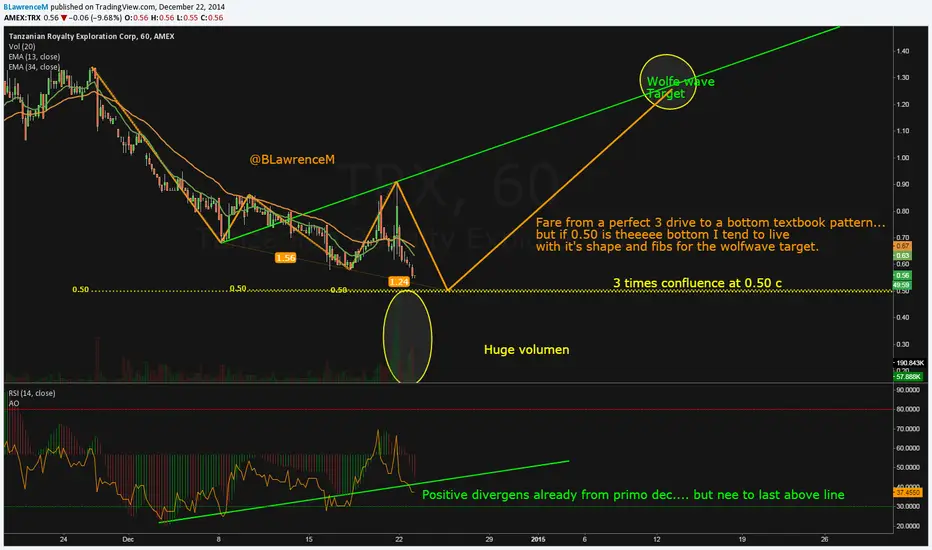
Not a 3 drive to a bottom textbook pattern...
but if 0.50 is theeeee bottom I tend to live
with it's shape and fibs for the wolfe wave target.
3 confluence points at 0.50 is very rare and could point to a bottom or at least a technical bounce.
RSI and the EW indicator AO showing positive divergens already from primo dec....... Yes a "d" is missing in....need :)
Volume has surged the last 2 trading days... shorts are getting out!
I see gold being in a wave 4 pennant and going for 1050/70... but see (junior) miners bottom before gold.
Short term: Bearish
Near term: Becoming bullish if 0.50 holds and divergens still in place
Long term Unsure It's a scalp play!
Safe trading ladies and gents!
@BLawrenceM
TRX trade ideas
TRX heading for dbl bottom and possible wave 2 down?Looks like a bear flag is forming after having made a double top at the 1.34
Could with the bear flag target be making a possible double bottom around 1.00
Spekulative:
I see as a possible wave 1 up with a very short and truncated 5th wave ending at 1.34.
Second waves normally make a deep retrace so a wave 2 making dbl bottom....maybe but within reach!
TRX's price movement is always dependent of the price of gold which seems to have getting stuck at the 1200 handle.
Safe trading ladies and gents!
@BLawrenceM

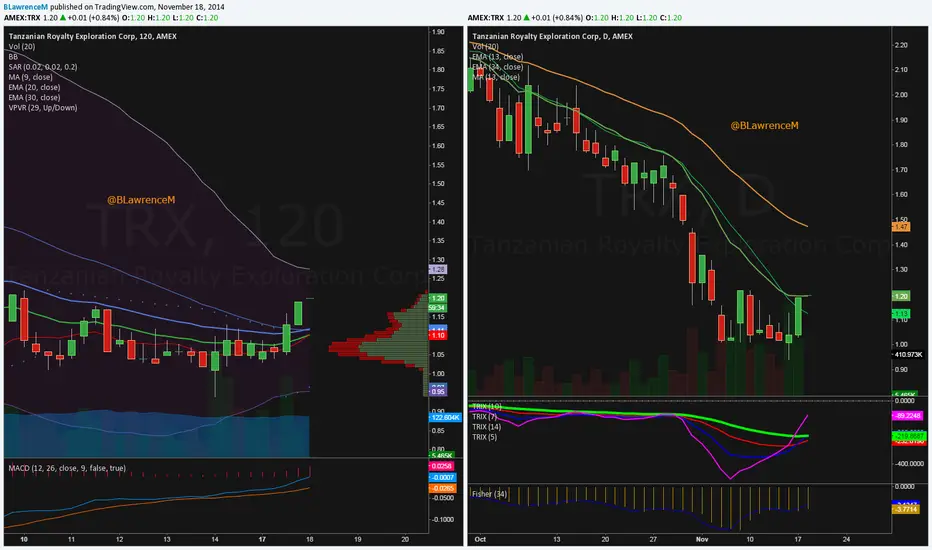
TRX in a Bowtie moveTRX is beginning to show signs of bottoming making a bowtie on the 120 min chart.
On the daily chart it's challenging the Elliott wave ma13 and stopped yesterdays move at the EMA13.
Fisher and Trix system (developed by nmike and JR on this site) looks promising
Notice that the Elliott Wave EMA34 there is a gap... could come in play on further advance
I'm neutral to bullish right now
Save Trading
@BLawrenceM
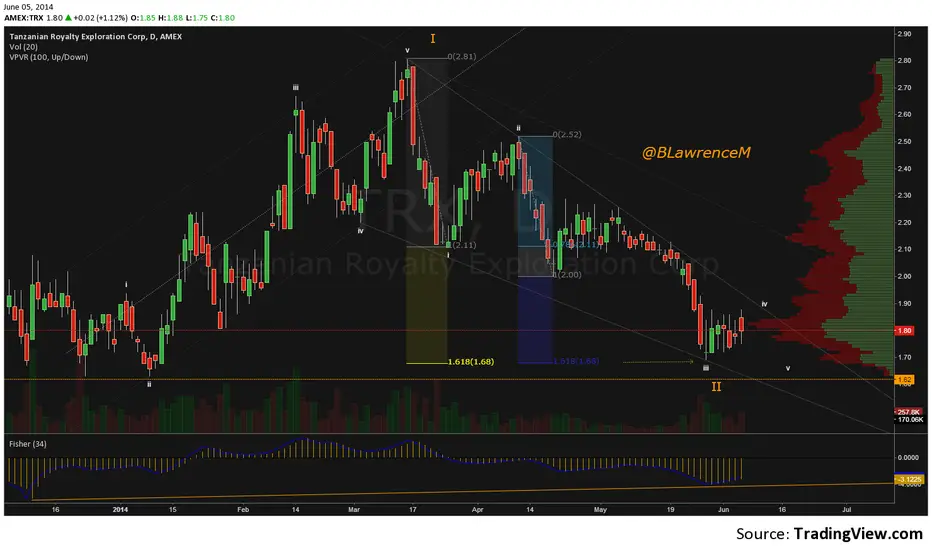
Why don't you - Why don't I ...BUY very soon?!?I count 5 waves up from 23rd of dec 2013 - ending at the 14th of march 2014.
Since then it's been making what looks like 3 waves down within a wedge formation ...with what also looks like and impulsive (3 of 3) wave down since the 5th of may 2014.
Is it working on the 4th? (Bear flag!!!) Looks like it!
The big Q is.
Is it a 4th wave with a 5th to come?
The low came in at 1.63 in dec. 2013. If price stays above 1.63 then bounce and make a lift off .....TRX could very well be in it's 1st wave of 3.
This makes it a very bullish candidate to invest in..
Indicators:
Fib extension levels comes in twice at 1.68. A bounce from here seems likely.
Fisher 34 has now positive divergens - making the lowest peak when at wave 3 low... (textbook right)
Volume Profile Visible Range: Bulls eager to defend the 1.80 area.
So levels to watch is:
Everything between 1.69 and 1.63
Safe trading ladies & gents!
@BLawrenceM
Music at work:
open.spotify.com
www.youtube.com
Turn around... at structural support ...ABCD done!Finishing a harmonic ABCD move at structural resistance seems to be in the cards.
The structural support and trend lines comes in between the 78.6 & 88,6 fib ...Could be making a hammer here going for the lowest fib and bounce!?!
Safe trading Ladies and Gents!
@BLawrence (I have often a quicker running updates on my Twitter account)
Music at work:
open.spotify.com
www.youtube.com (A nice remix)
Disclaimer: I'm not long yet but the trigger is itching ;)

TRX about to go long after a nice shortLooks like a Bullish Gartley Pattern is currently forming on the daily time frame of TRX.
My Fibonacci Ratio analysis:
The AB leg retraced nicely to the Fibonacci 61.8% retracement level of the XA leg.
The BC leg also retraced up to the Fibonacci 61.8% retracement level of the AB leg.
The Fibonacci 127.2% retracement of the BC leg falls right on top of the Fibonacci 78.6% retracement level of the XA leg
The 127.2% Fibonacci extension of the AB leg is 4 handles above the 78.6% retracement level of the XA leg.
All these factors point to a potential reversal zone around Point D.
Trade plan for this setup:
Place pending order to buy at point D
Stop loss is under fib 88,6 which I see as a secure bounce area
First Target is the 38.2% fib retracement level of the AD move around 2.27
Second Target is the 61.8% fib retracement level of the AD move around 2.47
Safe trading Ladies and Gents!
@BLawrenceM

Promise....? of a Bullish Gartley...?Well on a 60 min chart it does look promising with an Andrew pitchfork (Modified Shiff) and a Bullish Gartley combined.
2.14 should be intrance low. Correspond well with a 61.8 retrace of recent swing - creating a nice right shoulder in the IHS I have shown on the daily chart and the structural area there too.
But as always time will tell:
Safe trading ladies and gents
BM
Music at work:
Just been visiting The Canary Islands...so... a spanish/english song:
open.spotify.com
www.youtube.com
Wow...hot! Nice remembering the Salsa i danced

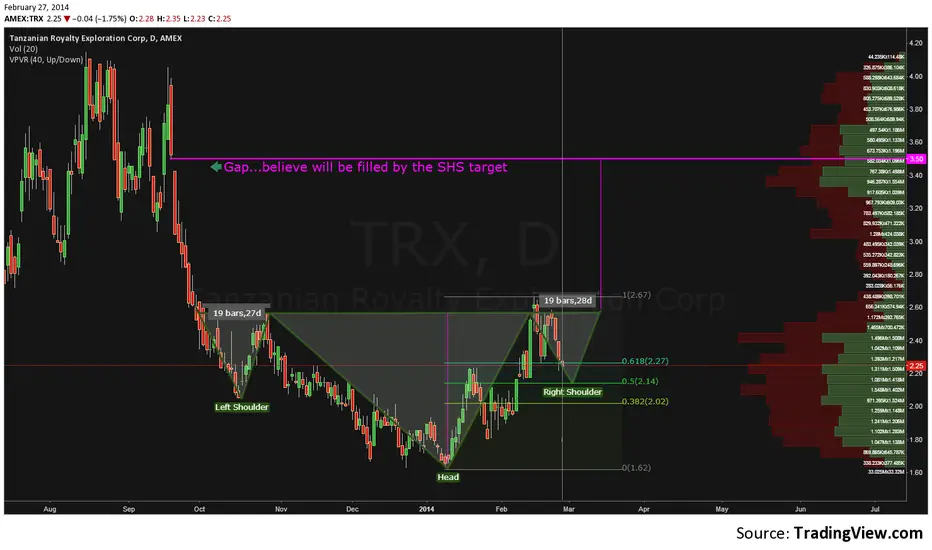
Certain things are likely...the shs hypnotize meI'm back from a month long vacation visiting the Canary Islands
It's playing out the way I draw my chart a month ago.... so just an update.
The stock is very bullish and so is gold. (XAUUSD).
If we are very very lucky we see a 61.8 retrace for a perfect right formed shoulder.... but doubt that it will be getting down there when it's that bullish. I do hope for a 50 fib retrace but see it most likely only making a 38.2 retrace
The left shoulder was in the making for 19 days - if market shows perfect symmetry...we'll see a neckline break close to medio march.
I have therefore starting a pick up of the stock again for a nice gap-close ride at shs-target :)
As always...safe trading ladies and gents.
BM
Music at work:
open.spotify.com
www.youtube.com
www.dailymotion.com
Happy just to be with youI'm short term bearish. But long term bullish
Looks like a x-wave up today. So took of 2/3
Chart a little messy I know but... we should see a zig zag down to yellow c
But as always...time will show
Safe trading ladies & gents!
BM
Music at work:
open.spotify.com
www.youtube.com

Where do you run to?So target for the three drive to a bottom is.....
Looks like there is a confluence of fib around 2.21 and comes in handy with the 200 ma on daily and the structural resistance zone.
I will be looking for a shallow retrace of 23.6 or max 38.2 fib for going bullish again heading for ma200. That will probably be coming in around 2.57 at that time.
I will be following the price of gold as well for confirmation on further upmove.
Speculative:
At 2.57 price action will stop and retrace - creating a possible neckline. Price then probably makes retrace to ma100. Price action could then be setting up a possible IHS.
BUT first things first ;)
Music at work:
open.spotify.com
www.youtube.com
But as always.... time will show
Safe trading ladies and gents!
BM

To the batmobile - Let's go!Looks like the bearish bat is out looking for Robin for a short while
after having had a three way drive to a bottom pattern
But as always time will show.
Safe trading ladies & gents.
BM
Music at work:
open.spotify.com
www.youtube.com
3'rd time's a charmTRX should be finding support for a 3rd time at 88.6 support zone
But as always...Time will show!
Safe trading ladies & gents
BM
Music at work:
open.spotify.com

Who's gonna DRIVE you home?Tree drive to a bottom pattern seems ready to pan out
With gold catching a bit I'm looking forward to see next weeks price action for finding a bottom.
I'm bullish in this area and looking for entrance to get long.
We might see a quick dip to fib 1,27 at the 1,56 handle to create a hammer candle but not necessary.
But as always.... time will show!
Safe trading ladies & gents!
BM
Music at work:
open.spotify.com
www.youtube.com

Let's park the car north from here!Gold need to catch a bid for this stock to prove a bullish move but does look interesting with this triple bottom
I'm neutral to long.... but could become bullish very quick :)
But as always time will show
Safe trading ladies & gents!
BM
Music at work:
open.spotify.com
www.youtube.com


TRX Head test or continuation pattern?At 60min / daily I see a bigger SHS. On the smaller time frames there is a possibility - first of all of a IHS with a consolidation period right now around 2,49 neckline. This IHS could create a later head test with a reach of the 1,27 fib. From there on...let's wait and see. Gold is still weak and could still be working on a double bottom in the 1200 area. The clouds on this development hasn't cleared yet

TRX Bull flag updateHad hoped for a more slow and easy bull flag and not just a quick pop up. Let's hope we see a back test during the day or a full gap fill.

TRX in small bull flagLooks like TRX with this small bull flag is setting sails for gap close at the 50 fib retrace

TRX in small bull flagLooks like TRX with this small bull flag is setting sails for gap close at the 50 fib retrace

TRXFor those who are bearish on gold - might see this shs on the TRX that could end up in a double bottom.
The harmonic pattern suggest the area around 2,61
The shs target around the 1,95.
Place your bets gent!
Safe trading
BM


TRX SHS Nice SHS target for the TRX... but of cause have to readh neckline and break it ;) I will add more text later

TRX done with it's abc korrektion or a move up nowTRX as well as Gold could have finished it's a-b-c korrection on the daily/weekly chart and we are perhaps to see more downside move. On the 15 min chart - gold has a shs at neckline. TRX is at channel line support.... so both has to rally north from here. In other words...we will have the answer tomorrow where gold miners (GDX) and gold are heading. For the TRX it could be double up due to the ihs, but neckline has to be broken first and RSI on daily has to turn around a rise above 50. But as always time will show.
Safe trading Gents!
BM
