A TRX study daily Elliott Wave count Part 5A daily Elliott Wave count. So fare the TRX is in a wave 3 of 3 making a breakout over the red resistance line. The same breakout is to be seen on gold.
I have mistakenly believed that the minor wave (green) 2 was part of a wave 4 zig zag. In hindsight it was obvious not the case. The TRX being in a wave 3 of 3. I'm of cause very bullish on the stock.
The TRX seems very much a live and kicking: www.youtube.com
TRX trade ideas

A TRX study using the Gann Box Part 4Seems like it follows this rhythm in the Gann Box. Adds well up with the Elliott wave count.
Just remembered: www.youtube.com

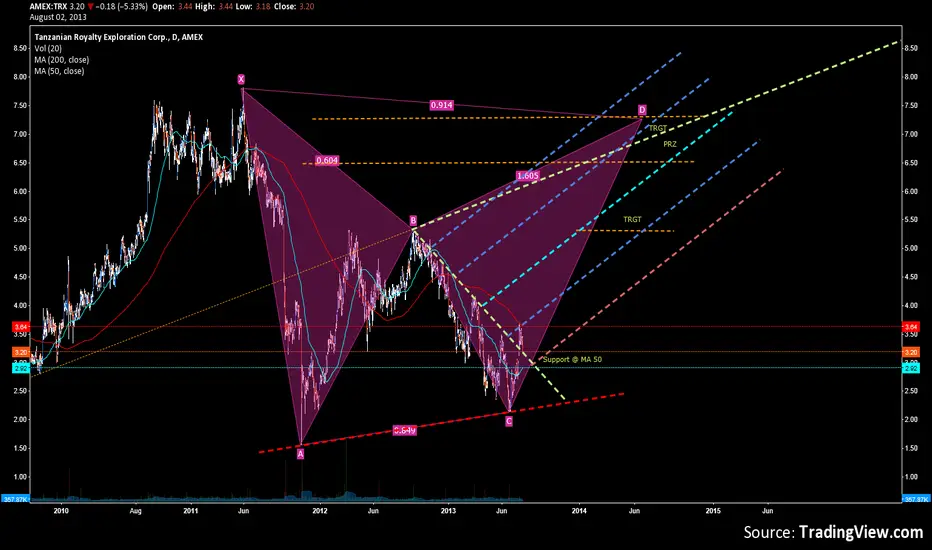
A TRX study with harmonic pattern view Part 3If the harmonic pattern - the bearish butterfly - plays out it does look like the e-wave form my TRX Elliott Wave study part 1 is in and a 1,27 fib could be coming . Bringing the stuck back to it's ATH


A TRX study from different angles Part 1This is my study of TRX beginning with a weekly view using Elliott wave.
I'm long term bullish on the stock.
I see TRX being in a triangle making a push up an break out after making an e-wave or an alt c-wave. The push will be in 5 waves up where it will meet the red resistance line. Here it will be determent whether it will be the alt d-wave and thus have a continuation out of the triangle pattern or we see an alt e-wave before turning up again. If the latter I expected the e-wave to meet the middle of the triangle wave before turning up.

TRX- worth a look and waitRejected by MA 200 and searching for support MA50. Downtrend is broken and leg D Gartley in the making.
Buy opportunity TRXA buy opportunity could be the retest of the broken upper red resistance line
Which I expected to break very soon :) .....after creating a small bullflag.in the 3,40ish area.

TRX Wave 4 done and now up Wave 4 played out as a double zigzag and not a triangle.
Normally a zig zag is a 5-3-5 wave structure and then an X-wave up. After this the same happens again, but I count twice - on the 15 min. chart - a 5-5-5 wave.
I'm heavily invested and buy any pullbacks for the wave 5

Harmonic pattern-possibilities for a goldminers daughter TRXNot everything in trading is summing up and fit a 100%, but I have tried finding the most likely "bullish patterns" which eventually all become bearish. But until then I see the stock being a long term good investment.

TRX Setting up for wave 5 upTriangle wave 4 done with a backtest ... I'm long
It could be 3,44 before it turns up so it takes the middle of the triangle for a wave E and then up....but it looks like it 3,49 or 3,48
Be aware of that the ABCD is set with the Gartley tool for creating the triangle. In Elliott wave the A should have been placed where B is ... B where C is and so forth.
SORRY! I see now it's confusing to use that tool, but never the less . TRX is moving higher

TRX Update! Gap and go expected very soon!I'm looking for a gap and go to happen very soon (might already be tomorrow or thursday).
Thursday could be the case for it to wait for the SP moving in to minor wave 3 as well.
If tomorrow I would expect a gap up to around the 2,80 level or as high as 2,86 and then to retrace to 2,78 level for a possible rest of the gap not to be filled. As to be seen on the 4 hour chart - the 2 purple circles are about identical, so I expect a bow-tie on the moving averages to happen creating the same shoot higher and to see a continue move higher for the wave 3 target.
Time will show Safe trading gents! BM


A gold bug about to flyLooking for 5 wave up. Republished due to wave points not shown correct the first time.

TRX a gold mine?I have made the weekly analysis and this time it's on daily. I see a gold miner stock with potential. Is at the bottom of a weekly pennant making a wave 2 down in an ihs bottom. Has retraced 61,8 from wave 1 top and should be ready to go north. Conformation is everything, so holding 2,80 for the next couple of days and then heading north. I'm in. Safe trading gents! BM

One for the Gold bugs!This stock seems to be in a major triangle that - looking with EW-eyes - have finished wave D (IV).
The nmike Trix-Fisher system showes cat ears and trix is turning up on weekly.
At the same time the D-wave has created a bullish Gartley pattern.. has turned and now moving upwards
For more info on the stock... Go to: www.tanzanianroyalty.com
For more info on Gartley Patterns...Go to: infinitycapital.wordpress.com
Safe trading gents!
BM
