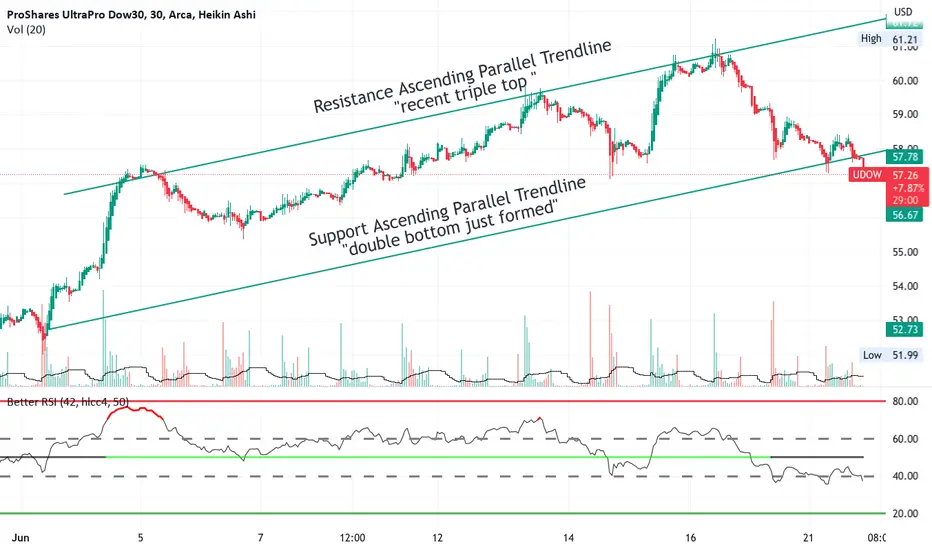
UDOW a triple leveraged ETF of the DOW indexUDOW is shown here on the 30-minute chart rising over the past month in an ascending
parallel channel. The chart shows the price currently situated near to the bottom of
the channel which is the support trendline drawn onto the chart with the resistance
trendline as well. My trading plan is I
Key stats
About ProShares UltraPro Dow30
Home page
Inception date
Feb 11, 2010
Structure
Open-Ended Fund
Replication method
Synthetic
Dividend treatment
Distributes
Distribution tax treatment
Ordinary income
Income tax type
Capital Gains
Max ST capital gains rate
39.60%
Max LT capital gains rate
20.00%
Primary advisor
ProShare Advisors LLC
Distributor
SEI Investments Distribution Co.
UDOW is a heavily levered bet on the Dow Jones Industrial Average, achieving 3x exposure to the index via futures contracts and other financial derivatives with counterparty risk. Like many levered funds, it delivers 3x exposure only for 1 day. Over longer periods, returns can stray from the intended 3x exposure to the DJIA, which means it doesn't pay to hold onto UDOW for long if the trend is not positive. The Dow is an under-diversified index of 30 companies that weights its constituents by an arbitrary statisticprice per share. However, the Dow's shortfalls are less salient in a levered, short-term product where diversification and weighting are less important. Trading costs, on the other hand, are very important to take into consideration. Don't jump in unless you fully understand the relative risks and rewards of levered vehicles.
Related funds
Classification
What's in the fund
Exposure type
Finance
Technology Services
Government
Stock breakdown by region
Top 10 holdings
Leveraged Share Conversion Calculcator Indicator coming soon! To be released this upcoming week :-).
Going over the functionality and setting up of my leveraged share conversion calculator indicator.
I will link it below upon its release.
This is the third and final reference indicator in my series, the other 2 being the Technical Das


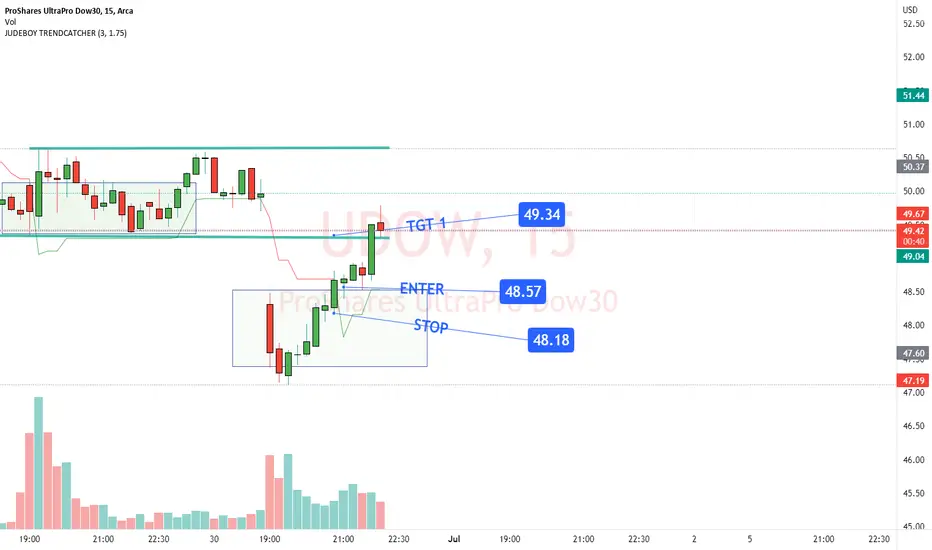
UDOW..buyLogic is that todays high got taken out..that means shorts of the inflation badnews are stuck should shoot up

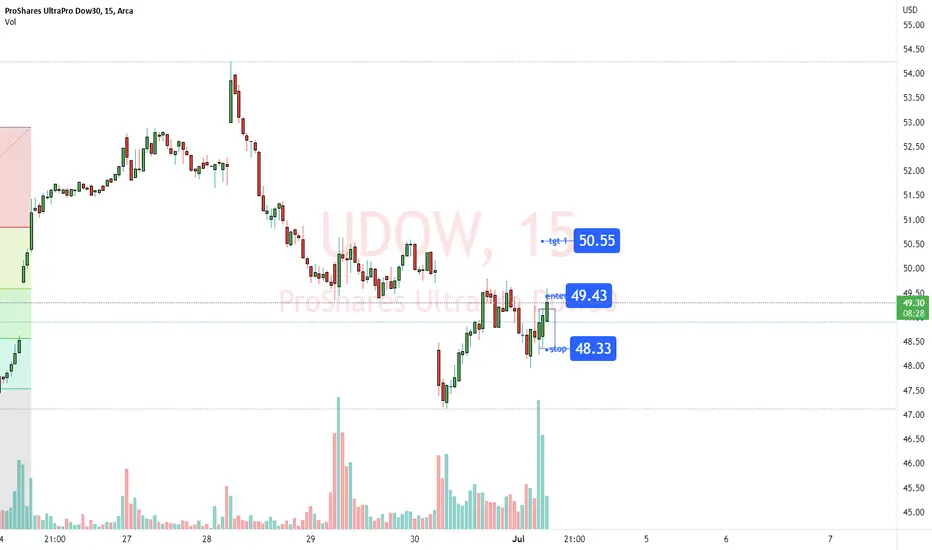
15 min Idea simple..UDOWWe bought on breakout of the 15 min candle ..so we went long and tgt is the first resistance...simple trick
UDOW might be good to start a position soon Hello All,
For now i am short the the DOW. The market looks kinda bearish but this market is still in the control for the bulls.
The last time we hit the 200day SMA was in November 2020. We are right at the 200 day sma and i believe we will hit this trend again before we lift off. Look for an oppor

How to set-up alternatives in your portfolio to dampen volTo start off, diversification is an investor's best friend and most handy tool. When thinking about long-term investing or even if you are a day trader trying to protect all your gains without just sitting on the sidelines, one must implement alternative investment strategies in order to stay afloat

UDOW (leveraged product) used to Trade Sentiment of DJIAI use UDOW when I'm bullish on the DJIA, which I am.
Yes, a leveraged product which inherits more RISK.
This is not investment advise.
A picture perfect ascending channel has formed.
(blue lines)
Start trimming positions at UDOW 104/share.
No need to short, trust start trimming.
BUY back more

See all ideas
Summarizing what the indicators are suggesting.
Oscillators
Neutral
SellBuy
Strong sellStrong buy
Strong sellSellNeutralBuyStrong buy
Oscillators
Neutral
SellBuy
Strong sellStrong buy
Strong sellSellNeutralBuyStrong buy
Summary
Neutral
SellBuy
Strong sellStrong buy
Strong sellSellNeutralBuyStrong buy
Summary
Neutral
SellBuy
Strong sellStrong buy
Strong sellSellNeutralBuyStrong buy
Summary
Neutral
SellBuy
Strong sellStrong buy
Strong sellSellNeutralBuyStrong buy
Moving Averages
Neutral
SellBuy
Strong sellStrong buy
Strong sellSellNeutralBuyStrong buy
Moving Averages
Neutral
SellBuy
Strong sellStrong buy
Strong sellSellNeutralBuyStrong buy
Displays a symbol's price movements over previous years to identify recurring trends.
Frequently Asked Questions
An exchange-traded fund (ETF) is a collection of assets (stocks, bonds, commodities, etc.) that track an underlying index and can be bought on an exchange like individual stocks.
UDOW trades at 90.21 USD today, its price has fallen −3.91% in the past 24 hours. Track more dynamics on UDOW price chart.
UDOW net asset value is 90.30 today — it's fallen 7.00% over the past month. NAV represents the total value of the fund's assets less liabilities and serves as a gauge of the fund's performance.
UDOW assets under management is 685.12 M USD. AUM is an important metric as it reflects the fund's size and can serve as a gauge of how successful the fund is in attracting investors, which, in its turn, can influence decision-making.
UDOW price has fallen by −6.98% over the last month, and its yearly performance shows a 1.23% increase. See more dynamics on UDOW price chart.
NAV returns, another gauge of an ETF dynamics, have risen by −7.00% over the last month, have fallen by −7.00% over the last month, showed a 14.18% increase in three-month performance and has increased by 3.60% in a year.
NAV returns, another gauge of an ETF dynamics, have risen by −7.00% over the last month, have fallen by −7.00% over the last month, showed a 14.18% increase in three-month performance and has increased by 3.60% in a year.
UDOW fund flows account for −44.10 M USD (1 year). Many traders use this metric to get insight into investors' sentiment and evaluate whether it's time to buy or sell the fund.
Since ETFs work like an individual stock, they can be bought and sold on exchanges (e.g. NASDAQ, NYSE, EURONEXT). As it happens with stocks, you need to select a brokerage to access trading. Explore our list of available brokers to find the one to help execute your strategies. Don't forget to do your research before getting to trading. Explore ETFs metrics in our ETF screener to find a reliable opportunity.
UDOW invests in stocks. See more details in our Analysis section.
UDOW expense ratio is 0.95%. It's an important metric for helping traders understand the fund's operating costs relative to assets and how expensive it would be to hold the fund.
Yes, UDOW is a leveraged ETF, meaning it uses borrowings or financial derivatives to magnify the performance of the underlying assets or index it follows.
In some ways, ETFs are safe investments, but in a broader sense, they're not safer than any other asset, so it's crucial to analyze a fund before investing. But if your research gives a vague answer, you can always refer to technical analysis.
Today, UDOW technical analysis shows the sell rating and its 1-week rating is buy. Since market conditions are prone to changes, it's worth looking a bit further into the future — according to the 1-month rating UDOW shows the buy signal. See more of UDOW technicals for a more comprehensive analysis.
Today, UDOW technical analysis shows the sell rating and its 1-week rating is buy. Since market conditions are prone to changes, it's worth looking a bit further into the future — according to the 1-month rating UDOW shows the buy signal. See more of UDOW technicals for a more comprehensive analysis.
Yes, UDOW pays dividends to its holders with the dividend yield of 1.34%.
UDOW trades at a premium (0.09%).
Premium/discount to NAV expresses the difference between the ETF’s price and its NAV value. A positive percentage indicates a premium, meaning the ETF trades at a higher price than the calculated NAV. Conversely, a negative percentage indicates a discount, suggesting the ETF trades at a lower price than NAV.
Premium/discount to NAV expresses the difference between the ETF’s price and its NAV value. A positive percentage indicates a premium, meaning the ETF trades at a higher price than the calculated NAV. Conversely, a negative percentage indicates a discount, suggesting the ETF trades at a lower price than NAV.
UDOW shares are issued by ProShare Advisors LLC
UDOW follows the DJ Industrial Average. ETFs usually track some benchmark seeking to replicate its performance and guide asset selection and objectives.
The fund started trading on Feb 11, 2010.
The fund's management style is passive, meaning it's aiming to replicate the performance of the underlying index by holding assets in the same proportions as the index. The goal is to match the index's returns.