Opening (IRA): URTY January 17th 51 Covered Call.. for a 49.25 debit.
Comments: With my usual leveraged go-to TQQQ in kind of the IV doldrums (IVR 18.1/IV 49.6), opting for a play in URTY with its 63.4% 30-Day IV instead. It's not as liquid and doesn't have nearly as robust an options chain as TQQQ, but I will make do.
Metrics:
Buying Power Effect/Break Even: 49.25/share
Max Profit: 1.75
ROC at Max: 3.55%
50% Max: .88
ROC at 50% Max: 1.78%
Will generally look to take profit at 50% max, roll out short call on test of take profit price, and add should I be able to get in at strikes/break evens better than what I currently have on.
URTY trade ideas

Opening (IRA): URTY February 21st 41 Covered Call... for a 39.07 debit.
Comments: Adding in at strikes better than what I currently have on, selling the -75 delta against shares to emulate the delta metrics of a 25 delta short put, but with built-in short call defense. I would prefer using TNA, since it's more liquid and has more expiries available, but already have a position on in TNA where the short call strike is at or above the -75, so don't want to add here.
Metrics:
Buying Power Effect/Break Even: 39.07/share
Max Profit: 1.93
ROC at Max: 4.94%
50% Max: .97
ROC at 50% Max: 2.47%
Will generally look to take profit at 50% max, roll out the short call if the setup doesn't hit my take profit.

Opening (IRA): URTY February 21st 42 Covered Call... for a 39.56 debit.
Comments: This ... is unwinding. Adding at strikes/break evens better than what I currently have on, selling the -75 delta call against shares to emulate the delta metrics of a 25 delta short put, but with the built-in defense of the short call.
Metrics:
Buying Power Effect/Break Even: 39.56/share
Max Profit: 2.44
ROC at Max: 6.17%
50% Max: 1.22
ROC at 50% Max: 3.09%

Sell URTY short term swing trade.URTY is forming an inside bar on the candle s. Look for a trend change to red! Stochastic turns down, STC turns red. Sell on next red candle! Place mental stop above last swing high. Great percentage trade setup!

URTY - the 3X leveraged ETF for the Russell 2000 LONGURTY seeks to yield 3X the Russell . The Russell has lagged the other major indices. This is
probably because this is a big collection of small companies which are weaker in general
and more suspectible to financial pressures like to cost of borrowing to finance growth and
so on. This week the Russell is out performing SPY, QQQ and DIA. These leveraged ETFs should
not be traded downside as the 3x causes expotential decay over time. Buy and hold will not
work well.
On the chart, the up trends as tracked by the "alpha trend" indicator are fairly obvious and
substantial. The zero lag MACD confirms buy and sell signals with K/ D line crosses. Entry
points are marked by a dramatic uptick in relative volatility making it easy to buy fast
and early in trend momentum, URTY is up nearly 20% so far in June. ( So much for sell
in May and go away). At present, it is waiting in consolidation waiting for more buyers
to step into its price action.

Can go in range - sell options!!Oversold at present. Hence, will be selling 110 PUTs expiring in month time. RUT is the only index oversold among other major US indexes (SPX, DJI and NDX). If assigned will sell 30 day calls for 110.
Tripple leveraged - trade with caution and with proper risk management.

Just wanted to remind about etfsMost ETF's are lower today. I'm adding some shares to my investment portfolio now...
URTY
ARKQ
TAN
XRT
XLE
FXI
UYM
IJR
ITB
IBB
EEM
IJH
EWA
QQQ
SPY
EFA
XLK
XLC
XLU
IYR
JETS
AGG
GLD
SLV
THCX
Do your own due diligence, your risk is 100% your responsibility. You win some or you learn some. Consider being charitable with some of your profit to help humankind. Small incremental steps work : If you double a penny a day for a month it = $5,368,709. Good luck and happy trading friends...
*3x lucky 7s of trading*
7pt Trading compass:
Price action, entry/exit
Volume average/direction
Trend, patterns, momentum
Newsworthy current events
Revenue
Earnings
Balance sheet
7 Common mistakes:
+5% portfolio trades, risk management
Beware of analysts motives
Emotions & Opinions
FOMO : bad timing
Lack of planning & discipline
Forgetting restraint
Obdurate repetitive errors, no adaptation
7 Important tools:
Trading View app!, Brokerage UI
Accurate indicators & settings
Wide screen monitor/s
Trading log (pencil & graph paper)
Big organized desk
Reading books, playing chess
Sorted watch-list
Checkout my indicators:
Fibonacci VIP - volume
Fibonacci MA7 - price
pi RSI - trend momentum
TTC - trend channel
www.tradingview.com

Russell2000 etf year in review: O$82.35 H$92.34 L$11.80 C<=>$79Russell 2000 etf year in review:
O $82.35
H $92.34
L $11.80
C <=> $79
Do your own due diligence, your risk is 100% your responsibility. You win some or you learn some. Consider being charitable with some of your profit to help humankind. Small incremental steps work : If you double a penny a day for a month it = $5,368,709. Good luck and happy trading friends...
*3x lucky 7s of trading*
7pt Trading compass:
Price action, entry/exit
Volume average/direction
Trend, patterns, momentum
Newsworthy current events
Revenue
Earnings
Balance sheet
7 Common mistakes:
+5% portfolio trades, risk management
Beware of analysts motives
Emotions & Opinions
FOMO : bad timing
Lack of planning & discipline
Forgetting restraint
Obdurate repetitive errors, no adaptation
7 Important tools:
Trading View app!, Brokerage UI
Accurate indicators & settings
Wide screen monitor/s
Trading log (pencil & graph paper)
Big organized desk
Reading books, playing chess
Sorted watch-list
Checkout my indicators:
Fibonacci VIP - volume
Fibonacci MA7 - price
pi RSI - trend momentum
TTC - trend channel
www.tradingview.com

URTY, SPY, QQQ 4 month comparison.Rotation anyone? In the beginning of November, a broader rotation to URTY, smaller Russell 2000 Index companies, gained almost 100% in 2 months, while the SPY & QQQ eked out a few +% gain. What's the next rotation? We've done the Coronavirus, FAANG, stay at home, technology, gold, bitcoin, real estate, automotive, vaccine, open up, election, stimulus, EV, renewable energy, ipo, energy & materials things. lol, is there anything left? haha. Or is the next move sideways consolidation, up, down or liquidation? We shall find out soon enough. Any brain storming ideas are welcome and encouraged. Thanks friends. Do your own due diligence, your risk is 100% your responsibility. You win some or you learn some. Consider being charitable with some of your profit to help humankind. Small incremental steps work : If you double a penny for a month it = $5,368,709. Good luck and happy trading friends...
*3x lucky 7s of trading*
7pt Trading compass:
Price action, entry/exit
Volume average/direction
Trend, patterns, momentum
Newsworthy current events
Revenue
Earnings
Balance sheet
7 Common mistakes:
+5% portfolio trades, risk management
Beware of analysts motives
Emotions & Opinions
FOMO : bad timing
Lack of planning & discipline
Forgetting restraint
Obdurate repetitive errors
7 Important tools:
Trading View app!, Brokerage UI
Accurate indicators & settings
Wide screen monitor/s
Trading log (pencil & graph paper)
Big organized desk
Reading books, playing chess
Sorted watch-list
Checkout my indicators:
Fibonacci VIP - volume
Fibonacci MA7 - price
pi RSI - trend momentum
www.tradingview.com

URTY - Russel 2000 continues it's November climb todayURTY, the Russel 2000 index continues it's November climb today. It's 52 week high = $92.34, 52 week low = $11.80. Do your own due diligence, your risk is 100% your responsibility. You win some or you learn some. Consider being charitable with some of your profit to help humankind. Small incremental steps work : If you double a penny for a month it = $5,368,709. Good luck and happy trading friends...
*3x lucky 7s of trading 101*
7pt Trading compass:
Price action, entry/exit
Volume average/direction
Trend, patterns, momentum
Newsworthy current events
Revenue & Earnings
Debt / Cash
Book value, assets
7 Common mistakes:
+5% portfolio trades
Bad risk management
Emotions & Opinions
FOMO : bad timing
Lack of planning & discipline
Forgetting restraint
Obdurate repetitive errors
7 Important tools:
Trading View app!, Brokerage UI
Accurate indicators & settings
Wide screen monitor/s
Trading log (pencil & graph paper)
Big organized desk
Reading books, playing chess
Sorted watch-list
Checkout my indicators:
Fibonacci VIP - volume
Fibonacci MA7 - price
pi RSI - trend momentum
www.tradingview.com
TradingView links:
www.tradingview.com
www.tradingview.com

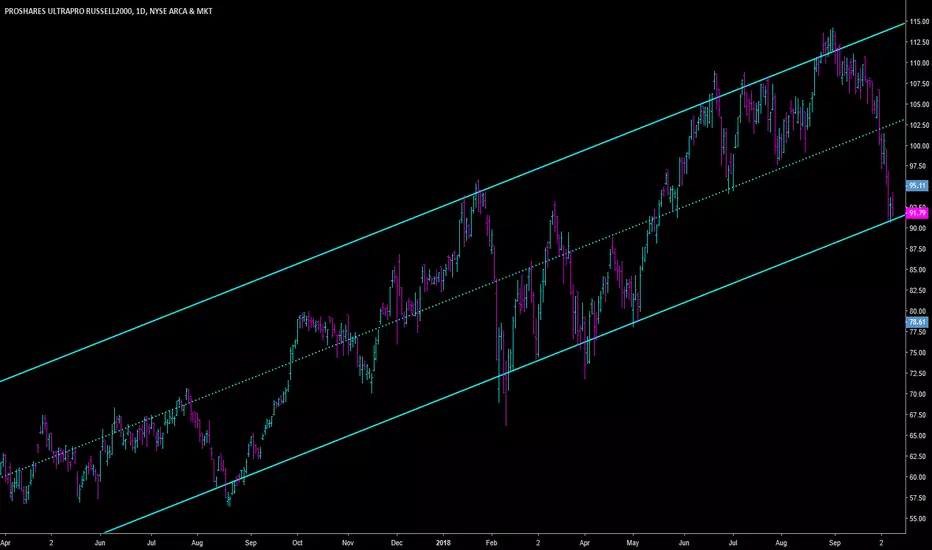
URTY parabolic move, looking for retracement sub 37Not the best setup there is; parabolic moves in the market are generally difficult to play, and offer alot of downside to upside. Though there is 5% of upside available in a trade like this, the downside based on previous lows (can crash relatively fast), are around 25%.
The Elliott count could be a 12345 with the primary direction up, and this could have completed wave 3, which would explain the "parabolic" nature. The alternative could be a ABC retracement, with the primary direction down. In my opinion, the case for the downside seems more favorable.
Copyright Rohan Karunaratne 2020

URTY up up upSupport and higher highs appear to be present to move price/volume higher at least in the short term


Good time to buy back in URTY for 15%+ returnURTY has reached a strong support with a potential return of 20% if it reverses. Great buy for a swing trade.

Great possible return of 10-15% on URTYGreat dip buy opportunity on URTY on a horizontal trend. Reputable ETF of the Russell 2000 has a possible return of 10-15%. Low risk etf with a great return in the next 1-4 weeks.