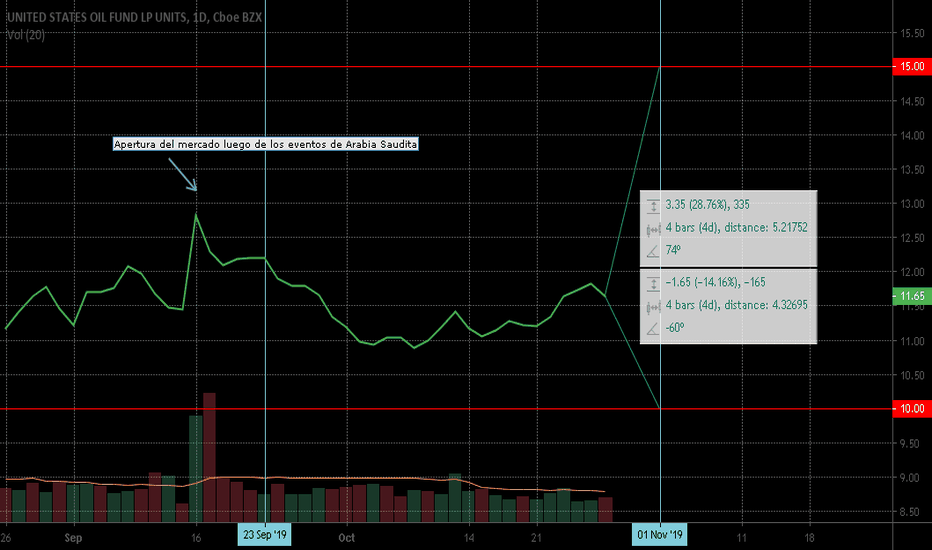
All Roads Lead to... Freaky Friday? - Mid-Term USO Overview
United States Oil ( USO ) falls on spread of Wuhan virus, U.S. oil-stocks build.
Currently $10.50 per stock or $50/bbl seems like local support while bearish downtrend still is in action.
Looking forward for major bearish continuation, until nearest (Mar '20) Triple Witch.
USO trade ideas
$USO May Now be a Contrarian Long TradeUSO has hit the skids amid demand concerns as China turtles under the weight of Coronavirus quarantining. OPEC+ has failed to deliver a cut.
But support is holding and a squeeze is possible because better days lie ahead, powered by new stimulus and a coming jump in post-quarantine demand.
USO - ETF will riseUSO: United States Oil Fund
- Most active strike prices are the weekly 1/10 $13.50-strike calls
- People are betting on USO will break out above $13.50 next two weeks
People are buying on this ETF because of what happened in Iran, crude oil futures, prices, and all else related are due to rising tensions. The assassination of Qassem Soleimani impacted the market yes, (SPX -0.71%, COMP, -0.79%, and DJIA -0.81%), but his death's biggest impact would be on the price of oil & gold.
Looking at USO, we can see that it has been in a bull trend since October of 2019 (2-3 months), and has gapped above it's previous resistance level of $13.00-13.15. A double top should still be something to be cautious about, but the recent news only makes this ETF much more appealing to trade.
technicals: Used fib extension to draw levels, worked wonderfully. Tested $13.35 level once and got rejected, if this level breaks on Monday, can see the next price target at $15.00.
- MACD: volume doesn't showcase anything as of yet, looking for a strong bull signal, be wary of fakeouts
- RSI: started to finally touch oversold area, good bull signal
USO looking great for this uptrendAs you can see from the daily chart, the Oil is being in an uptrend since mid Oct, and I expect this trend will continue until at least we have a double top. I’m staying long until I hit my target, which will the next resistant line at $13.25.
If you agree with my analysis, please share your thought. I would love to hear from you.
$USO Stumbles Into Major Catalysts to Close Out the WeekUSO
The United States Oil Fund LP (NYSEARCA:USO) is an exchange-traded fund that attempts to track the price of West Texas Intermediate Light Sweet Crude Oil.
One other major macro factor in the current scene guiding the macro picture for markets is the performance of the oil market.
Right now, both energy stocks and the oil commodities market are largely defined by the process of Saudi Arabia gearing up to go through the IPO of the largest energy company in the world, Aramco. Don’t think for a moment that this is not a primary concern for those involved in the largest positions dominating the oil market. Aramco, and its success as an IPO, I one of the defining points across all asset classes at present. The Aramco IPO will unquestionably be the largest IPO in stock market history.
And the relative performance of oil as a commodity market will be the number one input defining exactly how much that IPO is worth.
In addition, tomorrow will bring us the results of the latest OPEC meeting, in which the countries in control of OPEC’s destiny will decide whether or not to do further production cuts to support the price of oil.
Traders will want to pay special attention to this catalyst as it unfolds today.
Read More at: dailytrendingstocks.com
USO t.a. & set up 10/7/19USO was recently overextended at the RSI30 area and the price bounced at a common major support level @ 10.67 area. Price action is now breaking above previous resistance @ 11.12/11.13 level (reference 5min chart for clearer view). Price also broke above the EMA10, and is re-testing resistance @ EMA21 key level on the 4 hour chart, signaling the uptrend may continue if price breaks out above EMA21.
Possible entry:
@11.19
If intraday momentum supports uptrend and price action on 4 hour chart breaks above the EMA21
Stop: any break below back into consolidation area around 11.02 @ -1.38%
Exit: target SMA200, based on USO history, SMA200 is known to act as a major resistance level on the 4 hour chart. 11.61 area @ +4.07%
(OR) exit @ any "end of day close" below the EMA10 during uptrend. Convert stop to this trailing stop if short term uptrend above EMA21 confirms.


