$USO Inverse Head and ShouldersSuper bullish on USO with this inverse head and shoulders in the works.
USO trade ideas

UNITED STATES OIL FUND ETF (USO): Pivots, Supports & ResistencesFind Winning Trades In Seconds >> efcindicator.com (Special Discount)
UNITED STATES OIL FUND ETF (USO): All The Pivots, Supports & Resistences


USO Trade Setup - Long Term Bullish PredictionUSO - Bullish Long Term Prediction
With the oil fund bouncing off the weekly bottom
trendline support at 9.17, and a green candle over
candle formation and RSI issuance of a buy signal
on the oversold bounce, a break over the 8ma at
10.60 and a previous candlestick resistance break
over 11.09, price action could start to move towards
major moving average bull crosses at the 100ma 11.94,
200ma 12.47, 50ma 13.29, and perhaps even a run to
top trendline resistance around the upper $16's.

USO - oversold hook 20ma break retestUSO - January 5, 2019 Trade Setup
USO closed just under the 20ma at 10.21.
This oversold hook trade setup offers
profit potential with a Monday retest over
the 20ma and a break over Friday's HOD
at 10.38. Look for resistance at price
targets of 11.09 and the 50ma at 11.54

Oil has turned bullish. Buy July 2019 $10 Calls @ $1.50 or lessThe 3 EMA has crossed above the 12 EMA for a bullish signal. Oil goes up from January to July 80% of the time. Stop below the recent low plus 1%. Hal Lewis

USO due for a little bounce?See callout bubbles. Always measure your risk and be okay with being wrong ; ) Wait patiently and get the price that you want. Use the market. Don't let the market use you.


After an Epic Fall, Oil is Testing Major Rising Support! (USO)Hi friends! Welcome to this quick update analysis on the US oil market, via the USO ETF! Let's get right to it!
Looking at the daily chart, you can see that price has bounced on my rising blue trendline support, but we're now returning to it for another test. If at any point, the rising blue trendline fails to hold, price will likely fall to the next downside support level at 8.65. Now, the oil market is heavily oversold, but that doesn't mean that it can't remain in oversold territory, as prices move further to the downside. A bounce off of the rising blue trendline should send us up to 10.70 for a resistance test.
Happy Holidays Everyone!
I'm the master of the charts, the professor, the legend, the king, and I go by the name of Magic! Au revoir.
***This information is not a recommendation to buy or sell. It is to be used for educational purposes only.***
-JD-

24% Gone Since My November 11th Warning on Oil! (USO)Hi friends! Welcome to this update analysis on the US oil market, via the USO ETF! Let's get right to it!
Looking at the daily USO chart, you can see that the USO has been plummeting, since I warned about a potential fall to $10.70 on November 11th. The oil market has been in absolute freefall. You can see that it printed a bear flag (in black) right on top of my $10.70 target, and price has just melted straight through it. However, the USO is about to test major downside support. You can see that there is a rising trendline support level (blue dashes) that is produced from two major lows in the oil market. The first low is the absolute low from early 2016, followed by another major low in mid 2017, and now we are just about to test this rising trendline for a third time today. Since the market is extremely oversold, there is a decent possibility that we could see a bounce, or at least a pause on that level. However, if price smashes straight through it, we could be in for more severe selling.
Just below the rising blue dashed trendline, is a price level that is generated from the pivot low of 2017, at 8.65. So, if the blue trendline is lost, 8.65 would be the next stop. However, if the blue trendline is held, we will probably get a bounce back up to 10.70, to test the former support as new resistance.
On the MACD, you can see that the recent low in momentum corresponded exactly with the low printed when the bear market bottomed out in 2016. Momentum has since made a brief bounce, but is poised to cross over again to the downside. Regardless, price is closing in on the rising blue dashed trendline support. So, we will have to watch how the market reacts to it, to know what will happen going forward. Also for the record, a breakout above the 10.70 level would put a test of the 50 EMA (in orange) on the radar.
Happy Holidays Everyone!
I'm the master of the charts, the professor, the legend, the king, and I go by the name of Magic! Au revoir.
***This information is not a recommendation to buy or sell. It is to be used for educational purposes only.***
-JD-


USOIL - the 1.5 - year doom! TL:DR, Crash it!Perfect regular flat. 1 month divergent shows there will be a turn, but not until usoil crashes one more time. to enter shorts wait for a larger correction on a lower time frame.

USO - Neutral Iron CondorWith natural gas in play, opportunity here allows participation similar. Price extension to the downside should slow down & the neutrality should give room for risk management if directional assumption is wrong.
8/9/13.5/14.5 JAN19 IRON CONDOR @ 0.21 CREDIT
General plan:
Roll if necessary & if possible to reduce risk.
Target maximum profit, unless significant profit appears early.
Comment or direct message for discussion, or on other interesting ideas!
Follow for updates.

USO long, possible setupRSI+ROC have not been this low since early 2015/late 2014
Forming reversal candles on the weekly chart
SRSI and RSI+ROC are starting to curl up
Horizontals marked are the S/R levels to watch for possible rejections and bounces
Prices of each level are on the right side of the chart
----------------------------------------------------------------------
Possible trade for USO
Buy $11.11
Stop loss $10.46
Ultimate target $16.26

USO LongOil has taken one of the worst beatings in a while, definitely signs of a reversal forming here and therefor I am long via calls, looking for a move towards the yellow box as there is strong resistance there. Break above there would lead to a good couple weeks of uptrend, for now just an oversold bounce plus good news at the moment. A move below the top of the yellow box on the bottom would be a failed breakout and would be my stop area. Good luck happy Holidays.


USOThe upward Trend is broken! Oil begins to look bearish.
Support1 at 13.04
support 2 at 12.56
Support 3 at 11.75.
Short with T1 at 13.00
I use options USO Oct 12.00 puts.
Happy Hunting!


USO I will be on bounce watch for OIL for the next few days.Huge capitulation sell off today in OIL. Usually when everybody throws in the towel its time to look for buying opportunities.
Will be watching for a reversal pattern in oil.

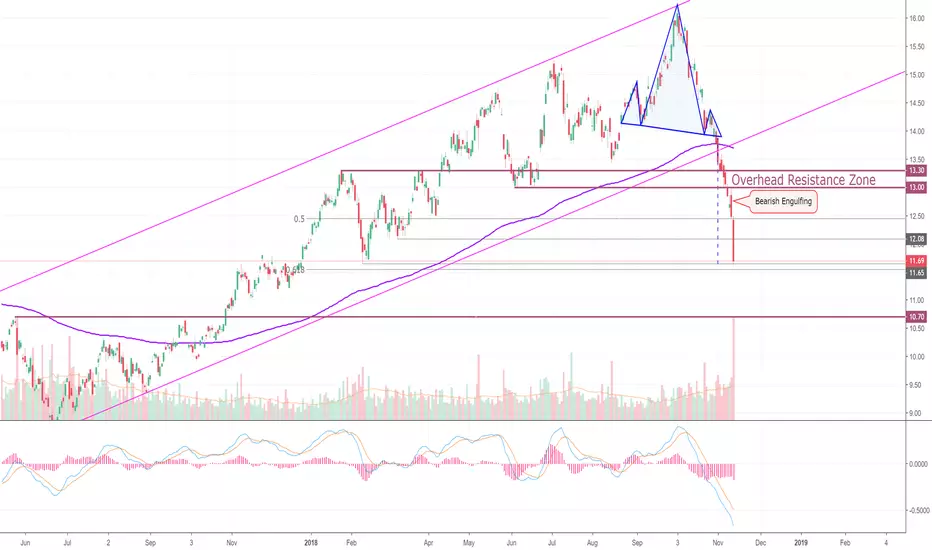
Oil Analysis On Fire! (USO)Hi friends! Welcome to this quick update analysis on the US oil market, via the USO ETF! Let's get it! Looking at the daily USO chart, you can see that price has plummeted, after I warned about the bearish engulfing candle yesterday. If you recall from my post two days ago, I said "I'm particularly interested in a rally up to the "Overhead Resistance" level at $13. If price rallies up to that, and then reverses away from it, I will short USO with a stop order just above $13.30." That turned out to be a perfect play, as USO rallied all the way up to $12.97, and then plummeted to $11.62, within two sessions. Interestingly, you can see that today's candle has stopped right next to the price target of the head and shoulders pattern on my chart (vertical dashed blue trendline.) So, the head and shoulders breakdown has been fulfilled, and it's time to take some profits off of the table. With that said, the sell volume today was enormous, and sell-side momentum is like a freight train from hell. The 61.8% retrace lies just below, at $11.65. If that level is violated, price could fall all the way down to $10.70.
I'm the master of the charts, the professor, the legend, the king, and I go by the name of Magic! Au revoir.
***This information is not a recommendation to buy or sell. It is to be used for educational purposes only.***
-JD-
Oil Crashes Into Major Support $USOOil is crashing today. It has been crashing since the beginning of October 2018. The Unites States Oil Fd LP (USO) topped out at $16.25 at the start of October but now trades below $12.00. This is an over 25% collapse in a month. Today looks to be capitulation with panic setting in. This means it is likely putting in a bottom for a bounce. The technical chart confirms this, showing major support at $11.85 and $11.70. I expect a major bounce back to $13.00 on the $USO.
