Wave pattern on the crudePossible downside move into the end of April, then the next left up into June
USO trade ideas


USO LongUSO long on reversion to mean (and reversal candle on 8 MA). Oil broke out past couple of days out of triangle consolidation, so USO should rally further for a while.

#USO #long #stockUSO symmetrical triangle breakout. I expect it retrace in an attempt to reclaim the trend line. However, breakout is textbook. I expect the stock to go higher over the next three months and much higher over the next several years.


Two Irritating ScenariosHi guys. Nobody likes two sided charts but here it is. I'm short since yesterday and still keeping my original target per my previous USOIL post. These two scenarios are based on the open interest for mid March. Question everything everywhere and every time. Imvho. Have a nice day.


Throwback failed on USODescribe the trade. What you see?
There will be a sell off in the USO what suggest the technical patterns and two supportd at 12.45 and bent, the problem could be only a contango.
Write why you want to enter the trade in this point?
it is ideal point befor two support levels
What have I done well for this trade?
I set well stop level and at the time think correctly
What can I take away to help with later trades?
I should more emphasise the importance of support and resistance level and more try to se more perspective also fibo etc.

Good Ol Black GoldBased upon data and the continued negative sentiment regarding oil supplies.
I believe USO will continue degradation.
The first short target is 11.02 and the second is 10.46.
March Puts at 12.00 are in play.
I expect a bounce at .686 Fib and then continued downtrend until capitulation of oil rigs in the fall. I expect crude to succumb to pressure until 55bbl is reached. The Oil Rally is over.

One of My Old PlaysWell, the cat is out of the bag....I am a renewable fuels guy and I know oil like no tomorrow.
Turn Around season is starting and refineries are stack up...inventories blew up this week as the tell tale sign of more to come for at least 4 weeks...Hence, short oil for the seasonal short....always happens!!!! I entered this AM and I am already up 50%...whew
Might as well share the wealth. Dollar is stronger too and wham again!...Good for at least 4 weeks of easy money...
Look for retracement to .618 and sell. could go to 9.20 ish but hey I am not greedy.
I love volatility

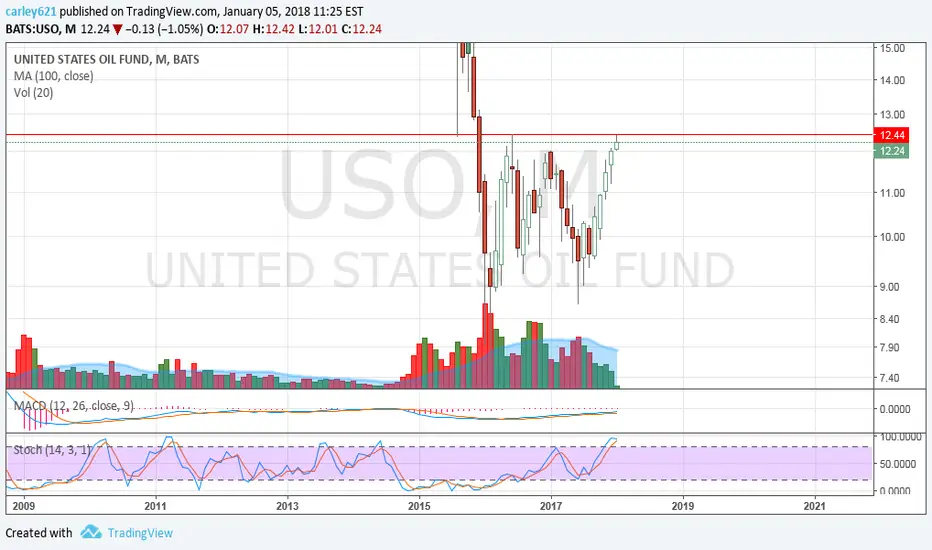
LT USOILGap down indicative of exhaustive price action at the end of a mature bear leg. Sellers were clearly in control of the market. Base / unwinding late 2015 to now , leads to the first close above the 100 EMA since Jul 2014 (3.5 years)- this is very bullish.
Couple this with a weakening dollar, and commodities gaining strength across the board and I think we have a decent long term trade. Play is a bit unique (1) trading w/ ETF (2) trading options against that ETF. This could be a killer idea for 2018 and will likely take a minimum of 2-3 months to get moving before folks start to pile in. This ETF is also lagging the underlying asset it tracks, which I feel is also bullish. In-flows to ETF's by novice traders are at record highs (out of mutual funds).

USO LONG SWING TRADE
I'm taking another long swing trade in oil in line with the powerful up-trend in this market. We may look to add on further price retracements toward our stop, but we will not take on more risk by lowering our stop.


Brake of the ascending triangleThere was a break fo ascending triangle and the pullback to the brake

USO - Monthly chart USO is right at a very strong resistance level. Do we break out or channel bound? If you think the economy is growing, well you know what to do.
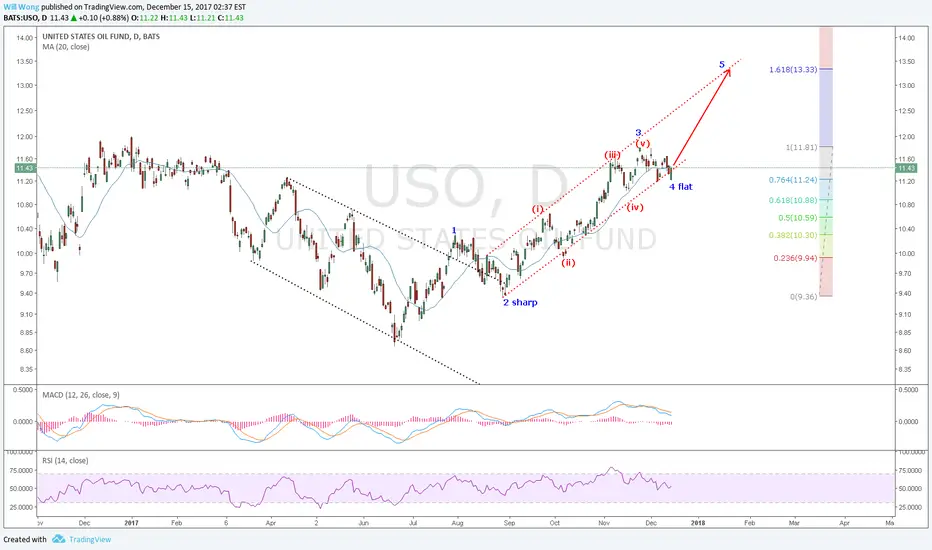
USO: An extended wave 4 correction looks finished and a new5th wave could take it to $13++. Wave 4 finished with a piercing candle fittingly.

homework :parallel channel (bearish)As long as prices decline trade within the channel,Channels are a form of technical analysis where prices travel in a trend( bearish in this case )between two parallel lines, ALWAYS remember that both lines need to be parallel to each other.


Bulkowski Ugly Double BottomJan 22, 2016
Characteristic Discussion
Price trend Downward leading to the chart pattern. For best performance, choose patterns at the bottom of the downtrend, not as part of a congestion region in an uptrend.
Shape Looks like a double bottom with unequal bottoms. The second bottom should be at least 5% higher than the first, be similar in shape, and a consecutive minor low (no intervening low).
Volume Recedes 81% of the time
Breakout Upward when price rises above the highest high between the two bottoms.
Confirmation The pattern confirms as a valid one when price closes above the peak between the two bottoms. If price does not close above the confirmation price then it's not an ugly double bottom .


