USO, US OILWith the trend line broken on USOIL, I have to expect further down side. Look for support at the 88.6% Fibo or more likely the retest of the last low, double bottom at $9.82. Indicators are oversold, BUT with the markets starting to sell off, its likely to find no support. I'll keep watching this one. Hopefully we get a good trade in a few days/ weeks.
USO trade ideas

USO Cyclic AnalysisUSO (Crude Oil ETF) has traced out ICL's (Intermediate Cycle Low's) roughly every 118-120 bars (TD's) or 171-174 (CD's). Note the swing lows on 02/11/2016 (coinciding with major stock index ICL's), 08/03/2016 and projected 01/20/2017 (next major ICL). Cycle high's have been a bit less predictive (represented by the dark green cyclic vertical lines). This past H-H was 93 bars (133 CD's).
Potential short-term low outlined with red trend line intersecting blue up channel line.

Oil Ready to Propel HigherThe USO has likely completed the current corrective move and is ready to resume the bullish uptrend as part of an extended larger degree wave (3).
While there is the possibility that the correction extends to target the 61.8% retracement of wave 1 around 10.74, the minimum number of sub-waves to complete wave 2 has been reached. Moreover, extended wave 3s tend to be very bullish and wave 2s often only retrace to the 50% or even the 38.2% supports before resuming the uptrend.
The ensuing move would see the USO rise upwards of 13 in the next couple of months, making for a nice medium-term gain as well as higher gas prices at the pump.


USO harmonic patternThese number are looking pretty close for two solid harmonic patterns
looking at a potential reversal in USO to about the 10.32 area.

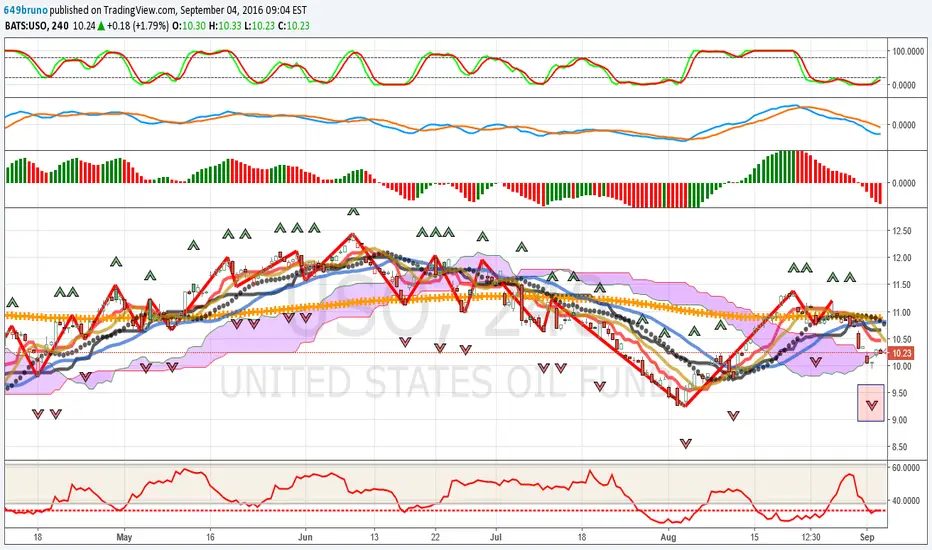
Dark cloud coverToday is a play with candelsticks. after nice run and 5 candesticks in overbouth teritorium it is a time to go down a little bit.


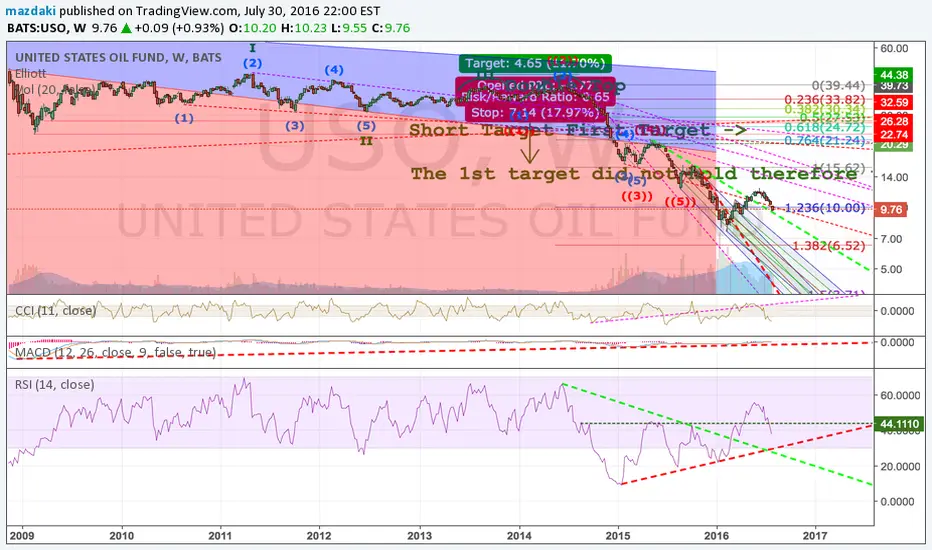
Could USO be Ready to Move Below $7.67?The USO may have just completed an Elliott Wave Horizontal Triangle. If so, a post triangle thrust down may have just begun. Usually a post triangle thrust is equal to the length of the widest part of the triangle, which in this case is 4.78.
If you subtract 4.78 from the supposed end of the triangle wave "E" at 10.61 it targets 5.83, it could reach this target by late October or early November.
The recent Commitment of Traders Report for WTI Crude Oil futures shows that Commercials - they have the largest positions, are still at a relatively high net short position. Commercials had their highest net short position in late May just before the WTI Crude Oil and USO high of the year.
A sharp decline in USO to a new low for the year could be a sign of a coming global economic slowdown similar to what happened in 2008. If this were to happen it would have a bearish effect on stock markets worldwide.
Mark

$USO $USWTI $UCOOil chart has possibilities here for a breakout. Everything is in place and holding today's gap is another bullish sign. No party yet until $USO gets over that R-Line and holds on volume.

Although it looks like a potential head and shoulderI think it is a consolidation and will break upwards... I am a buyer of USO and short TESLA


USO: US Oil Heading Down In Concert With Light Crude Oil FuturesThis is the third chart I am publishing relating to Light-Crude-Oil-Futures.
This one is for-US-Oil. (The second one was for the oil-service sector, which is heading down).
All three are very weak on the technical charts.
It stands to reason that if Light-Crude-Oil is going to sell down, the oil-service sector and US-Oil will be weak also.
All would confirm each other.
Just as with Light-Crude-Oil-Futures, There are many sell signals.
1. Sell Fractal in effect (rectangle on chart).
2. Alligator jaws opened in tandem with sell Fractal. Alligator feeding in down-trend.
3. Chop indicator (under chart) (indicates a trend or choppy action) is below the 38.2 shaded area. This indicates a strong trend coming that is down.
4. Phase energy (lower top indicator) is heading LOWER.
5. Momentum (middle top indicator) is the 5/34 measure, and this is heading lower.
6. Prices are trading below the Ichimoku Cloud .
8. Prices are trading below the Ki jun-Sen baseline of the Ichimoku Cloud. This is a sell signal.
9. Prices are trading below the thick red Ichimoku Cloud conversion line. This is a sell signal.
9. The trend-line is heading down (thick golden line just above the Ichimoku Cloud ).
I think US-Oil is heading LOWER. I believe Light-Crude-Oil futures are heading LOWER. I believe the oil-service-OIH-ETF is heading LOWER.
Good luck to you in all your trades. Don.
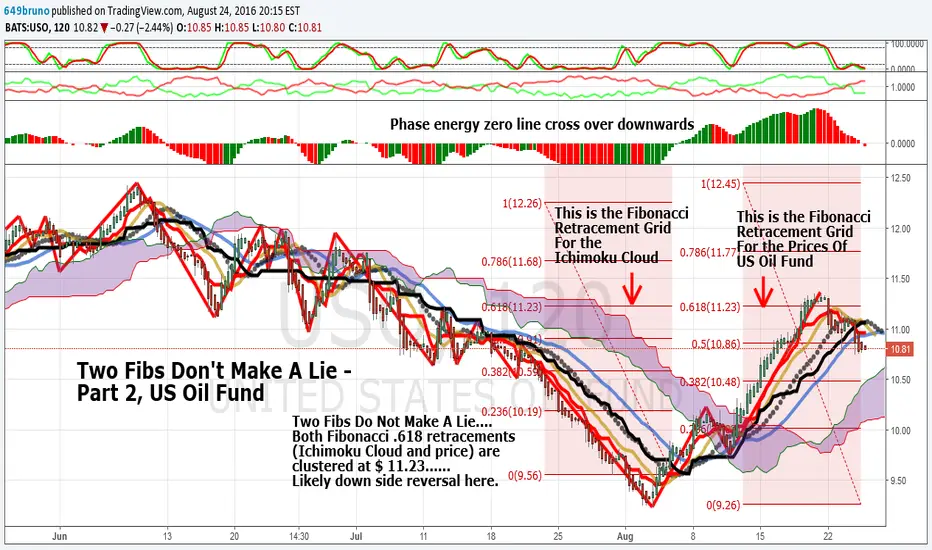
U.S. Oil Fund: Two Fibs Do Not Make A Lie, Part 2Does it stand to reason that if Light-Crude Oil Futures Are selling down, then the US-Oil Fund should be weak as a confirmation for the oil complex?
The above chart for the US-Oil Fund is very weak.
It has a double Fibonacci retracement at .618 (which is $11.23). At this level you would anticipate weakness and selling.
Let's look at my TRADE-MAP approach:
Here are the letters and what "TRADE-MAP" means to me (first the letters in TRAD E):
1. T : Time and space (Fractals); 2. R : Repeating Cycles; 3. A : Advancing Trend; 4. D : Declining Trend; 5. E : Energy in Phase Forces.
Now the letters in MAP :
6. M : Momentum and Velocity; 7. A : Analysis of Structure; 8. P : Price Performance. There you have it: Don's personal "TRADE-MAP" .
"Don's Top Ten Technicals" using TRADE-MAP":
1. The Ichimoku Cloud is lower on the right side of chart than the left.. 2. Prices are sagging towards the cloud. 3. Prices are trading BELOW the thick red Ichimoku Cloud Conversion line. This is a sell signal.
4. The thick red conversion line is moving SHARPLY LOWER. This is a sell signal. 5. The thick black line is the Ki jun-Sen baseline of the Ichimoku Cloud and this is rolling over to the down side (as are the indicators above the chart). These are sell signals.
6. The indicator on the top of the page is RSI / Stochastic , and this is not strong enough to rally-US-Oil on oversold readings. 7. The top-side middle indicator is vortex and this is STRONGLY NEGATIVE (red over green). 8. The Top-lower-level (bar-type) indicator measures the "phase energy", and this is VERY WEAK. It has now crossed over the zero line, which indicates selling pressure. 9. The red fractal arrows (not pictured) are DOWN. 10. Look to the far lower right on the chart, around $11. You will notice a yellowish line on the bottom (jaws), with black dots above (teeth), and a blue line (jaw) above the black dots. Now, all three are closing. This is where I ask you to use your imagination and envision these three items as the "jaws, lips, and teeth of a sleeping alligator. He will AWAKE, FEEDING into the DOWN-TREND.
Additional important indicators that are now shown:
The RSI has topped out on a daily chart for-USO and is rolling over and heading down. This will likely add to the selling pressure.
Vortex, on a daily chart, is beginning to head towards red over green.
Remember, daily chart action is stronger than hourly, but is takes longer for the daily chart to turn.
There are very few positives on this chart. It confirms the negative Light-Crude Oil Futures chart I published yesterday.
Good luck to you in your trades. Don.


Resistance in oilThe oil is comming to 40 so it should be at least a pullbak. Maybe target is a littel bit to optimistic.

USO long setupDropping oil price has crushed USO. This means that it is not a strong fund, but still favourable for a SMALL trade. It is bearing towards lower support at around 9. If this support holds and it bounces back, we are good to go long. But as mentioned, with a small position. SL can be set at 7.5.
Good luck

USO - the down turn is to shake out weak hands Move to higher local highs expected. Buy USO and short TSLA