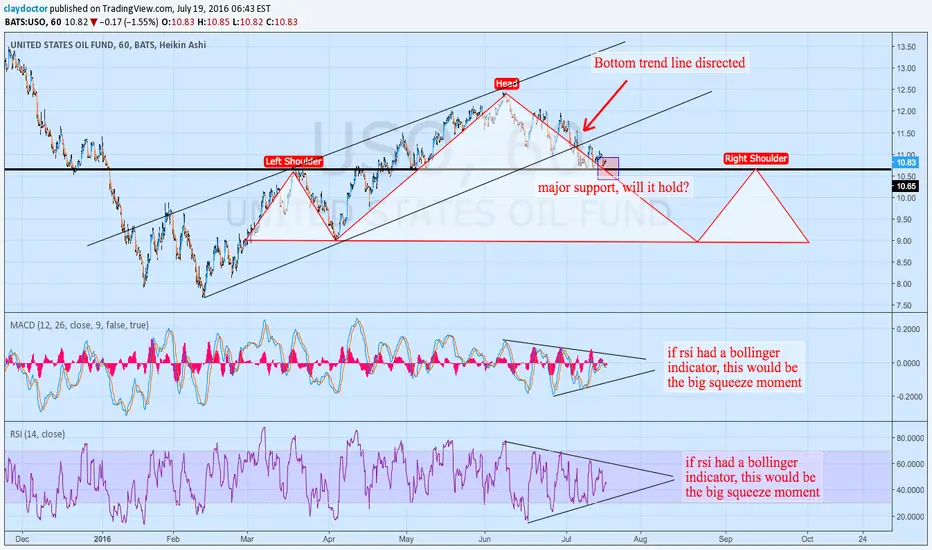
USO FUND - POSSIBLE DOWNTREND CONTINUATIONUnited States Oil Fund seems in a downtrend continuation. Shorting the pullback seems a good idea. A strong breakout on the black downward trendline could change the trend direction.
USO trade ideas


USO - 2hrI have a small speculative trade on for the (a) wave of v of 1 assuming a Leading Diagonal off the low. Using Oct monthly expiration 11 strike, avg 0.54 entry. This is a very aggressive position...


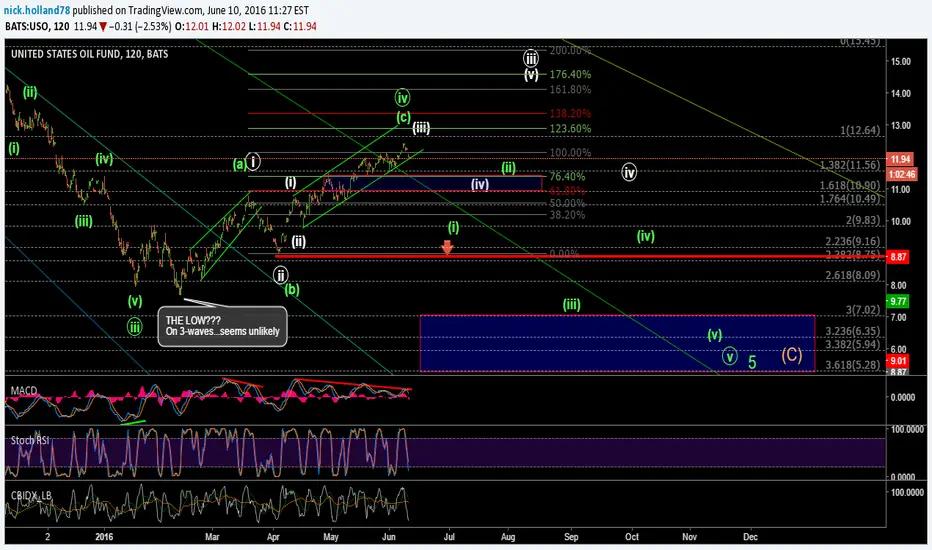
USO - 4hrMonths ago I'd posted skepticism that THE LOW could be seen on 3 waves in Feb. Since then, price has continued higher than I'd initially expected for the green wave iv. The green count is still valid - and last week I exited a swing short from near the June top. Given the time spent consolidating instead of breaking lower in a presumed green wave (iii), I'm again considering the possibility of a Leading Diagonal (which assumes THE LOW was seen in Feb).
Contemplating a long trade IF price holds over 10.18 region (micro count allows for one more low below 10.51 but its note required). The next rise should be corrective as prescribed by a diagonal - something like the (a)-(b)-(c) in v of 1 (white count). Could be a difficult trade, so I'll take it one move at a time. Strong decline without breaking back above 11.12 would be an indication that the green count is continuing.

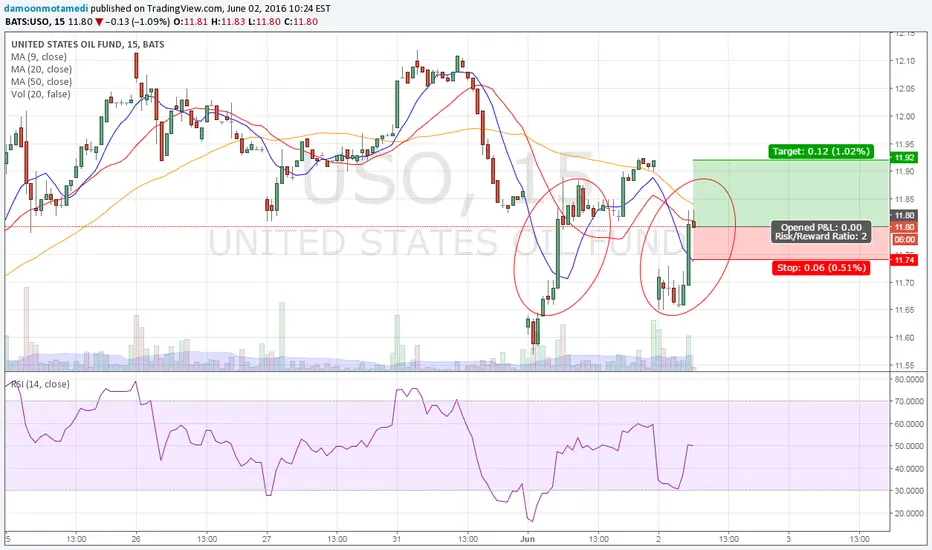
Potential Bearish trapIf this will be bearish trap which I saw a lot of times and play breakout it will be nice trade.


USO change coming or more of the samesee chart, I believe more trend down, once we break this major support area.


Short this baby! USORisk off move, weak hr trendily support.
Call credit spreads
trading light though Summer is no time to risk on low liquidity

USO / Oil - Possible breakoutPossible breakout for USO the oil.
See the full newsletter here: forum.marketstockoptions.com


Pitchfork breakdownI don't use pitchforks normally, but I saw one could be set up pretty easy on this chart and it's having a nice break down and out of the indicator.
the 12.50 pivot was a also a previous support pivot last August.
I could see the next major support being provided around the 100DMA

USO - Pull back!USO is pulling back. We are heading into a major support and we can play the bounce!

Bullish on $USOA series of bullish divergence suggests that the bottom is in for $USO. Time to go long.

USO - 2hGiven negative divergence on technical indicators, I took a short positions on USO and /CL earlier this week near the high. USO *may* have stopped below the 1.00 extension (12.64) of green minor waves i-ii. This would support the green iv-v of 5 of (C) <7.02. A corrective decline, however, would suggest the white bullish count could continue. This negative divergence isn't characteristic of a 3rd wave, so I'm cautiously short.
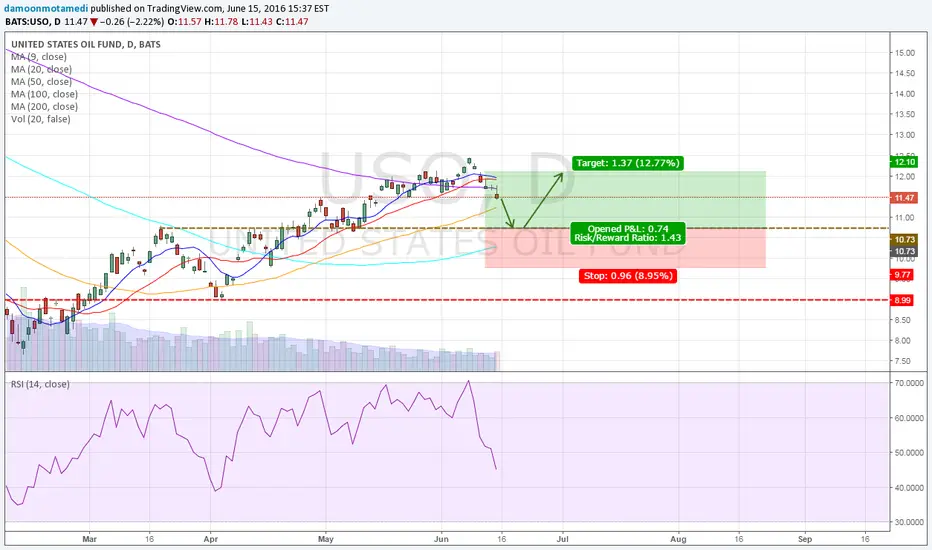
Almost hit my 18% goal. Risk increases into resistanceEarly May we discussed that bulls were attempting to absorb supply and that prices should breakout and test the next level of resistance near $13.00. It has been a great 14% trade; however, cumulative demand is contracting. It does appears to be worth the risk of giving profits back. Anticipate we will start to see some liquidation to protect profits and reduce risk.


USO - ALGOS everywhere!Looking at yesterday price action, algos are in charge everywhere and toward up!