USO Head and Shoulders formedBecause USO is a roll trade ETF you get a smoothed price without the rollover spike/drops you see in WTI.
Look at the head and shoulders it has formed,
Price target of 8.50
EDIT: Also note the falling RSI for the three peaks.
USO trade ideas

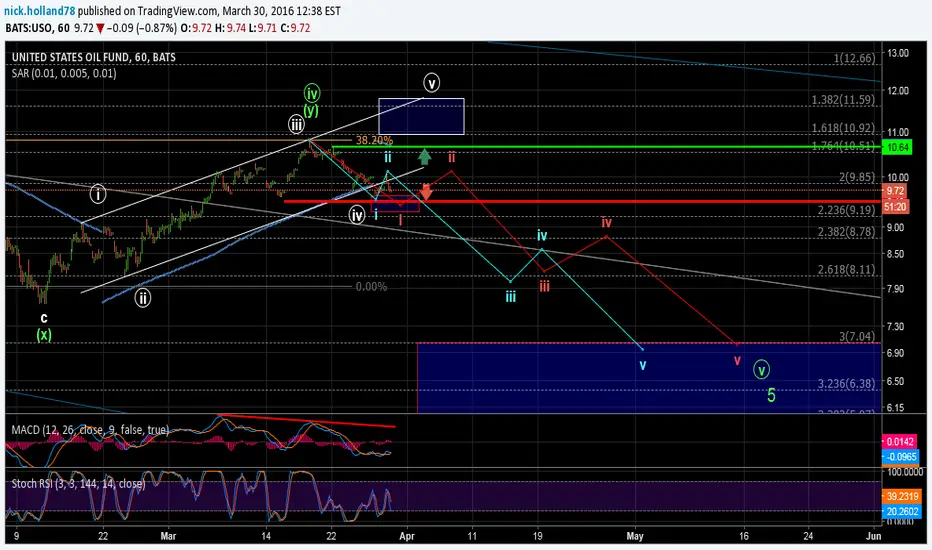
USO - 1hrTwo notional paths outlined. The new "blue" path is the most aggressive, whereas the red path reflects the expanded flat I'd notated earlier for wave (iv) of I. Below my red box the blue path becomes more probable. Regardless, I'm short from higher. Price staying below 10.64 is key to new lows; signal levels haven't changed.
USO - 30mWhile I'm not thrilled with today's pop, price is still below resistance. Nothing will change unless resistance is broken above 10.25.

USO - 15mToday's new low makes the white bullish count much less probable imo. Red bearish count is my primary at this time. See also hourly analysis.

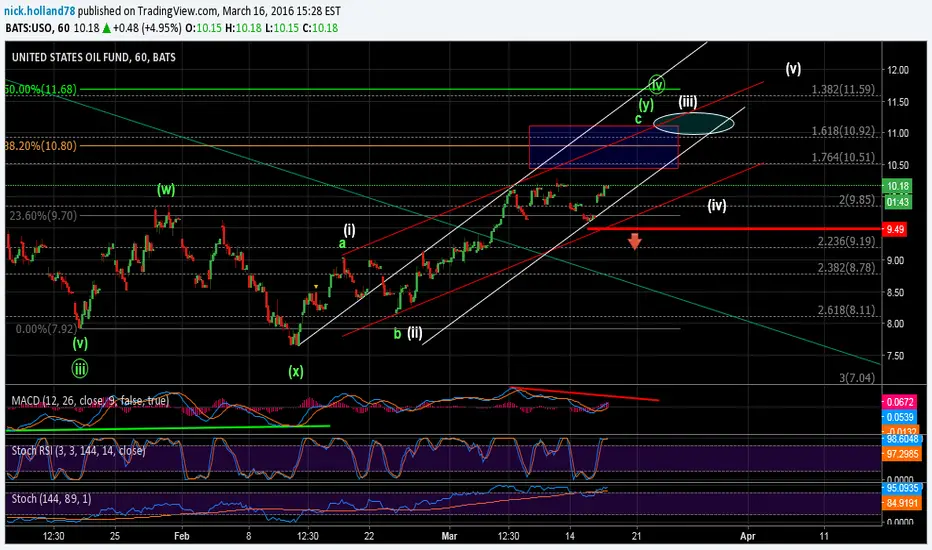
USO - 1hrUSO turned down at 10.80, hitting the 38.2% retrace to the penny in presumed wave (y) of iv (shown in green). Negative divergence does not necessarily prefer the bearish (green) interpretation over the bullish (white) one as such divergence would be expected into either 3-wave high.
Price recently broken through initial support and may be forming an impulse to new all-time lows (as reflected in the red count). Hitting the target box, bouncing correctively in wave ii, then falling below the wave i low would increase confidence in this count.
Disclaimer: I'm short from last week.


USO - 15 minUSO paused inside resistance yesterday (white box), but has gapped down this morning. Micro Resistance moved down to 10.14/.26. Larger degree support still in place as noted by the "Support" box down to ~9.71. This, like all markets, is not linear. Wouldn't be surprised by a few bounces along the way. As long as resistance hold above - which I'll keep moving down - then I'm expecting new lows.
Note also signature embedded stochastic RSI.

USO - 15minA 5-wave move below support is key, and I'd like to see 9.48 give way. Should this happen, then Support turns into Resistance. IF price moves over 10.80, then high 11s are possible for minute wave v (shown in white) for a presumed Leading Diagonal.

USO - 1hrNote negative divergence on hourly MACD. Price is right on top of support now. Micro wave 1 (in red) was lower in pre-market hours than shown on this RH chart.

USO - DailyUSO bounced right to the .382 retrace of minute waves ii-iii at 10.80...to the penny. The (presumed) expanded complex w-x-y structure made this a difficult region to trade. Confirmation of new lows will come on break down of the support region indicated on the chart.
Over 10.80, oil could form an impulse off the low. As no market is linear, I don't expect a rally over 16.20 immediately. But should an impulsive rally form, with retraces holding support along the way, then I'd start looking long with better confirmation of a significant bottom over 16.20.
1hr and 15m charts to follow.


USO - 1hrUSO has turned down from the 38.2 retrace, a common 4th wave target. Awaiting confirmation with an impulsive structure forming off the high. This bearish posture is suggested by my green / orange count. The complex expanded flat (where (x) made a lower low than wave iii) is one of several interpretations. IF this count plays out, then USO should be headed to new lows below 7.00.
A corrective decline holding support could be suggestive of the white bullish count.


USO - 1hrLong USO, however price is nearing resistance in a potential complex corrective rally off the January lows. A new high in price on divergent technicals could initiate a pull-back. The nature of this supposed pull-back will offer clues as to whether the low is in, or if on final decline lies ahead. Decline - should it develop - could extend below 7.00.
Given the February low was seen on a clear 3 waves down (labeled (x) here) I'm not confident in longer-term bullish prospects considering the Elliott Wave. Only a solid 5-up, 3-down holding support, and taking out the top of that initial 5-up would increase probabilities substantially in favor of a meaningful low last month.
USO can be scalped intraday, enter in bottom of channel.Long 9.66 -9.81 area. Tight stops if scalping. Rinse and repeat. Breach of 9.64 could be a ss trigger.

USO - DailyUSO has bounced between the 23.6 and 38.2 retrace measured between waves circle ii-iii. This is a typical target for wave iv, although the complex expanded flat w-x-y was a beast to trade. Fourth waves are notorious for trading difficulty. I'm anticipating one more low to complete this long-term correction. Overlapping action off the lows is not suggestive of a major bottom in my opinion. Price may prove me wrong however. The target box for circle iv indicated on the 38.2% of this chart is reachable, but its not necessary for price to hit this target before turning lower.

Short on USO after Iran commentsSeems like a good short on oil @ these point, lets see if the triangle pattern will brake

Ending Diagonal in Oil with a Weak 5thEnding diagonals almost always reverse quickly with a deep retrenchment. Expect an overlapping upward correction to ~38, the previous (iv) over the next 8 months. Its been a long slow decent, so probably a quicker upper correction.

The oil sell off isn't over yet.A lot of people have called bottom for oil but I am inclined to think that it still has room to fall. I think this last mini rally was a combination of people calling bottom and the third short squeeze (albeit a small one) since this time last year. Once the short covering is done the bears will take over again.
Hop in short and wait for stops to start triggering when all of these short sellers are done covering and the bottom callers were wrong to continue the downtrend, throw in Saudi Arabia and how they claimed that they are willing to drop and hold at $20/barrel as long as it takes to ensure all of the companies with high production costs are forces to end operations, and oil has a lot more room on the downside before it begins a recovery.

BOUGHT TO CLOSE USO JAN 17 7/APRIL 1ST 8.5 SYNTHETIC LONGClosing this synthetic long USO play here for a small profit. My timing was a bit off as to entry (I went long on the break of the 2009 low at 32.70), and we may have seen the short-term end of the up move here.
Will consider reloading another synthetic long now that a new low of some kind has been put in ... .

USO hourly RSI double backed on support to go longNotice the horizontal RSI trend line, has been resistance since november, and it broke, so it's now support. If this support doesn't hold, which there's a chance it may not since it's overbought, the RSI will reach the diagonal RSI bull trend. This one has a very high probability of holding because it matches the price action's up trend.

USO - IHS in Play!If today we close above the neck line, we could see $10.30 in next couple of days! Lots of shorts will scramble to cover and that would fuel the possible rally!

