$USO to 50day SMA, POUNCE ON PUTS AT THE GAP FILLRefer to a previous post. Breakdown has begun but I suspect a gap fill before a follow through. POUNCE on the gap fill for a swing $70 3/15 Puts High.
USO trade ideas
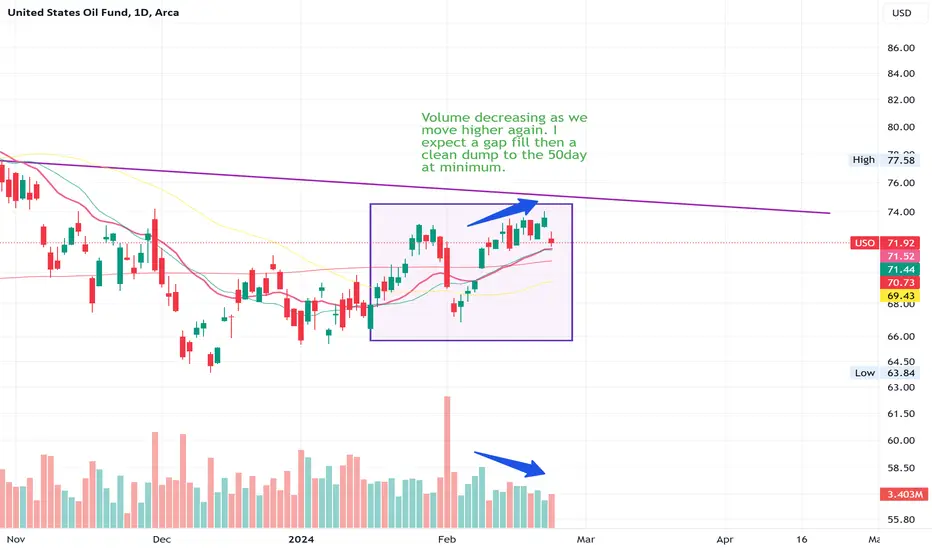
$USO back to 50 day at minimum AMEX:USO Headed back to the 50 day. Really quick. Will continue watching to see if we hold $69s or break lows. I'm expecting the pullback to resume after a quick stall at the 20day sma. The giveaway that helped pay last time was the rally above the death cross. That first rally is usually bearish as noted in the chart posted. Fast forward and we have the same setup today. Good luck out there.

Idea: USO short Put spreadLooking to sell 60 strikes on USO out to Jan 19, 2024.
That's 1 deviation down and about 45 days out.

USO Long Next week Tgt $90-95 This grabbed my attention because I had a notification in my calendar for today with the stock FTI possibly scheduled for a move up. It's some oil stock my dowsing chose in November along with the stock TTI, but I'm not doing an idea on that one. I did do FTI.
So to confirm bullish in FTI, I check USO and it's very consistently bullish. I feel really good about this and the opportunity rating is a 9 from 0-10 scale.
I suspect USO could be down Monday morning in which case you want to buy it and we're looking to be long into March 16th or so (ugh I see it's a saturday) so let's say the 15th.
It may get into the 66-67 zone, but big picture, the main idea I believe is to buy it on Monday morning.
I left my old higher targets on the chart for the idea from back in November. It did give a date of March even back then, so that's consistent.
The first target today my pendulum went to was around $93, but I'm doing something new, which is asking for the most capitally efficient profit target, which gives around $90.
Another reason I'm kind of pumped about this is that I totally nailed the last high on USO (even though I don't think I noted it in my idea). So It gives me some confidence lightning can strike twice!

USO Stock Chart Fibonacci Analysis 020824 Trading Idea
1) Find a FIBO slingshot
2) Check FIBO 61.80% level
3) Entry Point > 69/61.80%
Chart time frame : D
A) 15 min(1W-3M)
B) 1 hr(3M-6M)
C) 4 hr(6M-1year)
D) 1 day(1-3years)
Stock progress : A
A) Keep rising over 61.80% resistance
B) 61.80% resistance
C) Hit the bottom
D) Hit the top
Stocks rise as they rise from support and fall from resistance. Our goal is to find a low support point and enter. It can be referred to as buying at the pullback point. The pullback point can be found with a Fibonacci extension of 61.80%. This is a step to find entry level. 1) Find a triangle (Fibonacci Speed Fan Line) that connects the high (resistance) and low (support) points of the stock in progress, where it is continuously expressed as a Slingshot, 2) and create a Fibonacci extension level for the first rising wave from the start point of slingshot pattern.
When the current price goes over 61.80% level , that can be a good entry point, especially if the SMA 100 and 200 curves are gathered together at 61.80%, it is a very good entry point.
As a great help, tradingview provide these Fibonacci speed fan lines and extension levels with ease. So if you use the Fibonacci fan line, the extension level, and the SMA 100/200 curve well, you can find an entry point for the stock market. At least you have to enter at this low point to avoid trading failure, and if you are skilled at entering this low point, with fibonacci6180 technique, your reading skill to chart will be greatly improved.
If you want to do day trading, please set the time frame to 5 minutes or 15 minutes, and you will see many of the low point of rising stocks.
If want to prefer long term range trading, you can set the time frame to 1 hr or 1 day.

11 Week Pattern in $USO in 2023The methodology shown here is what I call "Time@Mode" because of a pattern of counting the number of bars at "the mode" of a trend and using that count to project the time of the move out of that mode.
I found the pattern by plotting charts by hand back in the 1980's, but fine-tuned here at TradingView with the powerful charting and tools available to us, amongst many other innovations and discoveries.
What you can see is a pattern of 11-week moves that have occurred AFTER AMEX:USO , or Crude Oil's ETF, formed 11 weeks of time in the uptrend* from March 2023 through July 2023. I have highlighted the range of the mode from 63.21 to 63.97 using the blue price tags.
Once the mode has set and the market either "range expands away" from the mode or simply has an "entire range" above the mode (for an uptrend), then the timer starts and you can count the rally starting from the start of the 'range expansion bar' or the 'bar above the mode' as bar 1.
*Step back a moment to define 'trend':
"UP-trend" is whenever there is a period of 5 bars without a new low AND when the last price is > the mode from the low. This is the case from the low in March 2023. The opposite is true for downtrends.
It is a simple definition and it works.
To continue the story of the 11-week pattern: AMEX:USO had an 11-week accumulation or 'mode' back in March-July 2023 which set up an 11-week rally into September 2023. That was followed by an 11-week decline back to the 11-week mode in December 2023.
Since that low AMEX:USO has been rebounding and this is the 8th week of that rebound.
Will the pattern keep repeating?
We shall see.
For now, at least you know the pattern.
Cheers,
Tim
11:38AM Feb 1, 2024 AMEX:USO 71.80 last
If you have two t

USO ( Oil Futures ETF) Swing Trade Review LONGThe idea was that while US Oil is not directly affected by the tensions in the Middle East as
most of it is domestic consumption, what portion of it that is exported does not go through the
Suez Canal but rather across the Pacific to Asia mostly. The idea was expanded by no matter
that, the Middle East quagmire affects global oil prices all intertwined. The China recession
is a drag on oil prices as is Russian sales below market but no matter the shipping costs have
gone up and so also the price of what is being shipped.
The 30-minute chart shows the trades based on the premise of a volume profile with the
evolving high volume area between the blue lines and price simply a black line. As the price is
supported by the lower black line and resisted by the upper black line and the price is expected
to rise, the trade plan was to "buy low" when the price dropped to the lower black line with
two lots of shares. When the price rose to the upper black line sell one of those lots and run the
other to gradually acquire more shares and average up. A high-volume area breakout 3 days
ago was also used as a buy signal.
As of the present, the trade is carrying five lots of 10 shares each. Profit has been pulled out
in partials each time a lot has been sold at a red down arrow. The trade close signal will be
from the RSI indicator when the fast RSI line in green goes under the slower red RSI line.
Upon closure, the profits will be redeployed by shorting USO using a similar strategy: short
selling at the top of the high volume area two lots of shares and buying to cover one lot at the
bottom of the high-volume area. Although this trade is a slow-moving swing trade used for
disciplined and deliberate trading, it is very low risk with moderate profit and for the most
part is risk-free because the entry points are relatively precise especially if using a shorter
time frame than the 30 minutes here.

USO 1d Chart, Q1 2023 USO, looking to be forming a double bottom within a double bottom off a long-term trend line. Personally looking for its reaction in the 72-73 range before any further assumptions, but if this gathers steam, I could see this reaching 76.
This is important for the overall inflation narrative, with energy being such a large component of the CPI.

USO Stock Chart Fibonacci Analysis 011424Trading Idea
1) Find a FIBO slingshot
2) Check FIBO 61.80% level
3) Entry Point > 69/61.80%
Chart time frame : C
A) 15 min(1W-3M)
B) 1 hr(3M-6M)
C) 4 hr(6M-1year)
D) 1 day(1-3years)
Stock progress : B
A) Keep rising over 61.80% resistance
B) 61.80% resistance
C) Hit the bottom
D) Hit the top
Stocks rise as they rise from support and fall from resistance. Our goal is to find a low support point and enter. It can be referred to as buying at the pullback point. The pullback point can be found with a Fibonacci extension of 61.80%. This is a step to find entry level. 1) Find a triangle (Fibonacci Speed Fan Line) that connects the high (resistance) and low (support) points of the stock in progress, where it is continuously expressed as a Slingshot, 2) and create a Fibonacci extension level for the first rising wave from the start point of slingshot pattern.
When the current price goes over 61.80% level , that can be a good entry point, especially if the SMA 100 and 200 curves are gathered together at 61.80%, it is a very good entry point.
As a great help, tradingview provide these Fibonacci speed fan lines and extension levels with ease. So if you use the Fibonacci fan line, the extension level, and the SMA 100/200 curve well, you can find an entry point for the stock market. At least you have to enter at this low point to avoid trading failure, and if you are skilled at entering this low point, with fibonacci6180 technique, your reading skill to chart will be greatly improved.
If you want to do day trading, please set the time frame to 5 minutes or 15 minutes, and you will see many of the low point of rising stocks.
If want to prefer long term range trading, you can set the time frame to 1 hr or 1 day.

$USO looks like a great shortJust like everyone think GOLD is going higher, people are overly bullish oil because of the war, blah blah, *insert your fundamental bias here.*
The reality is, the chart looks like shit. Price just rallied directly into resistance and has now formed a lower high confirming resistance at $79.
The price of oil is going much lower from here.
I wouldn't touch this from the long side until we get into the green support levels.
Good luck to all of the people bullish oil here because it won't turn out well for you.

USO Stock Chart Fibonacci Analysis 121923 Trading Idea
1) Find a FIBO slingshot
2) Check FIBO 61.80% level
3) Entry Point > 69/61.80%
Chart time frame : C
A) 15 min(1W-3M)
B) 1 hr(3M-6M)
C) 4 hr(6M-1year)
D) 1 day(1-3years)
Stock progress : B
A) Keep rising over 61.80% resistance
B) 61.80% resistance
C) Hit the bottom
D) Hit the top
Stocks rise as they rise from support and fall from resistance. Our goal is to find a low support point and enter. It can be referred to as buying at the pullback point. The pullback point can be found with a Fibonacci extension of 61.80%. This is a step to find entry level. 1) Find a triangle (Fibonacci Speed Fan Line) that connects the high (resistance) and low (support) points of the stock in progress, where it is continuously expressed as a Slingshot, 2) and create a Fibonacci extension level for the first rising wave from the start point of slingshot pattern.
When the current price goes over 61.80% level , that can be a good entry point, especially if the SMA 100 and 200 curves are gathered together at 61.80%, it is a very good entry point.
As a great help, tradingview provide these Fibonacci speed fan lines and extension levels with ease. So if you use the Fibonacci fan line, the extension level, and the SMA 100/200 curve well, you can find an entry point for the stock market. At least you have to enter at this low point to avoid trading failure, and if you are skilled at entering this low point, with fibonacci6180 technique, your reading skill to chart will be greatly improved.
If you want to do day trading, please set the time frame to 5 minutes or 15 minutes, and you will see many of the low point of rising stocks.
If want to prefer long term range trading, you can set the time frame to 1 hr or 1 day.

USO US Crude OIl ETF trending down SHORTUSO on the weekly chart over the past two and a half years makes a symmetrical triangle
patter with the upper and lower trendlines drawn in. Price appears to be dropping out of
the pattern in a breakdown and she now yet tested the prior support trendline as resistance.
The Stochastic RSI and Zero Lag MACD are confirmatory. The Relative volatility indicator shows
downward volatility exceeding upward for six weeks now. Putin just met with OPEC+ in
Saudi Arabian. It is doubt that the OPEC+ has the fortitude to cut supply to force prices higher.
Dropping the price of oil nicely supports global efforts to stymie inflation for the good of all except
perhaps OPEC+ and Big Oil. I will take a short position in buying put options on USO.
I will strike $ 60 because the puts will be cheaper and I expect the price to drop below that
into a volume void on the profile and not be easily able to get above the volume shelf at
$63 where I will set the stop. I am targeting $35.00 which is comfortably above the volume
profile POC line. I will take an expiration next July during the presidential nominations.
Politicians are also wanting oil prices to drop to keep voters happy. All goepolitical events will
have a bid in the price action of the puts.

Is this thing working? USOOPEC+ production cuts are in the news today. Also in the news is the message that the cuts haven't convinced people that there will be enough demand. AMEX:USO Oil has a strong support at $58.
Is the reaction in NYMEX:CL1! Crude Oil overdone?
This isn't a forecast, it's a thread to generate ideas of potential direction and supply/demand.
Please let me know where you think oil is headed as we wrap up 2023!
Cheers

Low in USO target $94-96Since I was pretty close back in July at calling the next high (though I didn't know it at the time) in USO around $83-85, and my dowsing keeps bringing my attention to it, I figured I'd check in more seriously on USO and post an idea.
Early last week was telling me to look for a low on Thurs. It's really good when price has a big move on my dates since they are often reversals, and Thursday USO was down over 4%. Then I had to buy it on Friday (but I bought on Thursday).
That held up super well, so I think it's a longer term low in place. It might be a bit choppy over the next couple weeks fyi.
When I've asked for prices over the last couple weeks I've gotten a prices all over $90! Specifically, $94 on 11/10, $98 11/16, and today got $96.
I asked how long this takes and got "months" as an answer, specifically 4.
I really want to see this last low hold.
We'll see!

USO Bull Put spread on -1 sig testSymbol USO
Open Date 11/8/2023
Put or Call Put
Expiry Date 1/19/2024
Short Strike 65
Long Strike 64
Price to Open 0.24
Min Width Multiple 2
Risk Ratio 3.17
Return on Risk 31.6%
Opening DTE 72
1 Day ROI% 0.44%
Max Annual ROI % 160.1%
USO has the worst calendars of any ETF.
Tested the Bullish Daily -1 sig in the morning and I sold behind -2 sig at 65.
Essentially giving it 1.25 sig of room to win.
Had to go out to the Jan 19 just to get the spreads though, so that sucks.
Did not want to be near 66 or 67, so had to be far out on the calendar.
This one is rolled out so far that I'll have to buy it back if it stalls at 73.50.
If it gets the Bull hard push above VWAP at 75.50, then I'll be more likely to let it expire until something else becomes available.
Have to watch some economic analysis, but not sure why Oil related markets are falling so hard and fast.
Because nothing says LOWER oil prices like a war in the Middle East with a Terrorist group... WTF?
It's like the 2020/2021 SPY rally where nothing says GO TIME BULLISH like shutting down the entire global economy for 6 months... WTF?
The Fed is the ONLY thing that matters apparently.

USO take it slow!Tomorrow would be 9 days under the 2 day MA of highs if a lower than todays high on the opening. It is with rare containment ratio that I would be willing to get long without any other consideration. Perhaps a lower low as my stop loss. If a higher high than today I would also take that as a trigger to buy.

USO 3d 2023 Publishing the USO 3 day chart.
Oil is currently getting beat up with the forward outlook for a slowdown. Oil getting soundly rejected after running into a long term trend line. This looks like it is heading sub-$70 in the near term.
Previous XOP idea, with XOP also getting rejected at a similar long term trend line:

USO - watch it go!USO:
23 day MA of lows - zero slope
62 day MA of lows - zero slope
2 day MA of highs - containment ratio of about 3
Going to be watching low 76s as pivot zone very carefully tomorrow

Oil Leading Dollar Lower? Watch Oil!Rising yields have lead to a massive sell-off in OIL markets foreshadowing: tighter economic conditions, cheaper energy prices and lower inflation prints - ultimately resulting in a weaker dollar / stronger euro in the short term. Globally inflation took off mainly as a result of covid stimulus exacerbated by Russia’s invasion of Ukraine. Even though the war is far from over the supply chain kinks / export bans caused from it are mainly resolved. Lower natural gas prices result in cheaper fertilizer and food. Cheaper oil reduces manufacturing and transportation costs. Higher yields and higher energy prices are a cure for themselves.
If a Dollar pullback / Euro rally is expected, a rally in risk assets will ensue. Lower inflation leads to greater speculation of a soft landing ultimately resulting in softer economic conditions - beneficial for risk assets. I believe Oil has shown the markets hand and is notifying us of weakness in yields/dollar. Gold may look to breakout of its 3 year range between $1600-$2000. A return to pre-war levels for the dollar will give Gold and risk assets a boost. On a longer time period, I remain bearish EURO / bullish Dollar in the long term as I believe the economy remains resilient elevating inflation into next - dispelling the soft landing scenario. However in the next 3-6 months, I can envision a weaker Dollar and all that comes with it.
Supporting Charts will be posted below.

USO - Finishing a B WaveAlthough we hit .382 and that could be "enough", to start a 5th wave, the formation of the current wave has the tell tail 3 moves endemic to a B wave, leading me to believe we will have a C down to circle 4 before starting a climb toward circa 93.

Commodity Oil Idea Price Region to watch: $72.5 to $82
Plan watch price till Friday - EOW
Falls below $72-73 is a pull down to $70
EOW could mark biggest loosing weeks of the year
To check:
- 6th October price action
- 13th October price action
- Any OPEC meetings/ news

USO Oil in strong trending channelUSO has been in a very bullish channel since the early summer. Waiting for a pullback before playing options, but holding a diversified position in Oil and Tanker stocks. Buy and hold here.

USO OIL TOP MOVING INTO PUTS IN THE MONEY 2024The chart posted is the oil ETF USO for oil > I now feel it is time going into the window dressing for wti to have peaked I will now take a 85 % net short oil using puts on USO best of trades WAVETIMER !
