USO SHORTUSO shifted this morning and is more
bearish again. My entry would be 1 tick
below todays low
USO trade ideas

oilers are mostly not in favor
This oil fund is dying and trying to get momentum on the daily chart here. Back in August it tried to be somebody but, it held until November 12th of this year. Tried to recover and puked again I believe that this oil fund is soaking up the oilers for an example: Cabot oil and gas $COG, Conoco Phillips $Cop, Hess Corporation $HES, and Diamondback Energy INC, $FANG and more like this. SPDR S&P Oil and Gas Exploration and Production $XOP tells a different story far as price goes. Been in this range since the last day of November of last year. Today has been questionable for SPDR S&P Oil and Gas Exploration and Production $XOP should I rally or puke? We had noted Carrizo Oil and Gas $CRZO was trying to go revstrat and go back up on the day, it’s a inside week along with Chevron corporation , Valero Energy, and most of oilers are inside week also.

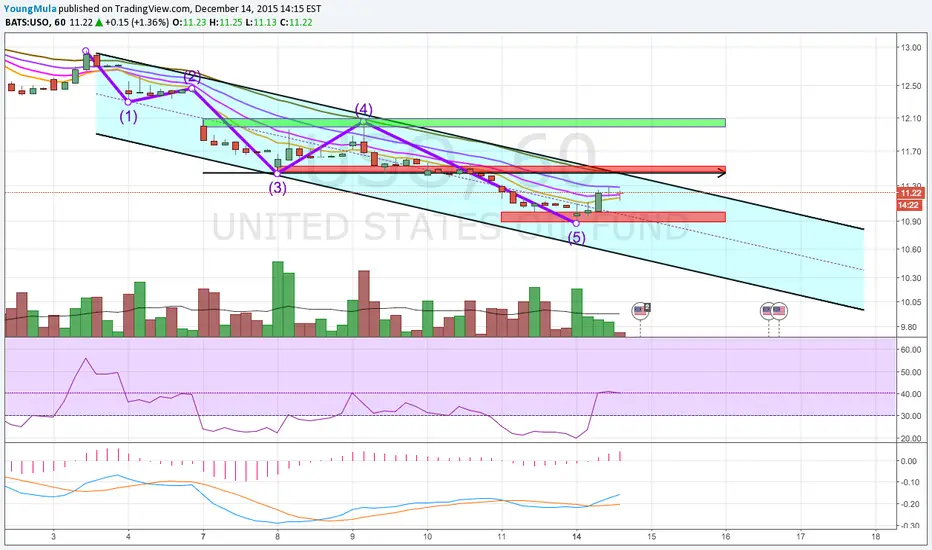
$USO Falling Wedge with Bullish Divergence60 minute chart of $USO shows a falling wedge formation with bullish divergence.
Watching for a break higher.


USO is this a turning pointIs this the turning point for oil... not sure.. It's got to be sometime..


LONG USOtechnically oversold
weather in US in the upcoming weekend will help
Decision: Long
Stop Loss: 10.95

Oil fund What’s this setting up for ? Is test the support four days and failed, will this expand to the downside, support at $10.89 can this hold? If $USO doesn’t get upside


Andrews 0 to 3 line with a ( well oiled:) timing technique!Hello all,
Oil has been pushing lower with some nice tradeable swings...I am looking for a reaction here after a 7 out of 8 (TD) day sell - off. I have an interesting timing technique integrated with both the downward grey modified schiff pitchfork and an upward white 0 to 3 Centreline technique that I sometimes use to pick up the slope of the counter trend move and at least 1 ( sometimes both ) low & high pivots before a continuation of the downward push.
Note the Timing Technique: If you follow the color coded (a,b & c lower to a,b &c upper) letters & arrows you will see the colored triangles terminating @ the horizontal grey dashed line @ 16.15 have already picked up 2 out of 2 Low pivots of these counter trend moves. Will it be 3 out of 3??.
Let's see how things unfold.
Sincerely,
Ross B

USOLooks like a Butterfly. Price has be responsive to bands recently, so I do wonder if we'll flag for a few days before continuing upwards.

USOThe Gartley has a tight PRZ and the SHARK posted earlier has not met upside. Tricky here. If this area is lost look for MA support, then Crab. However, that SHARK may still want to fulfill.

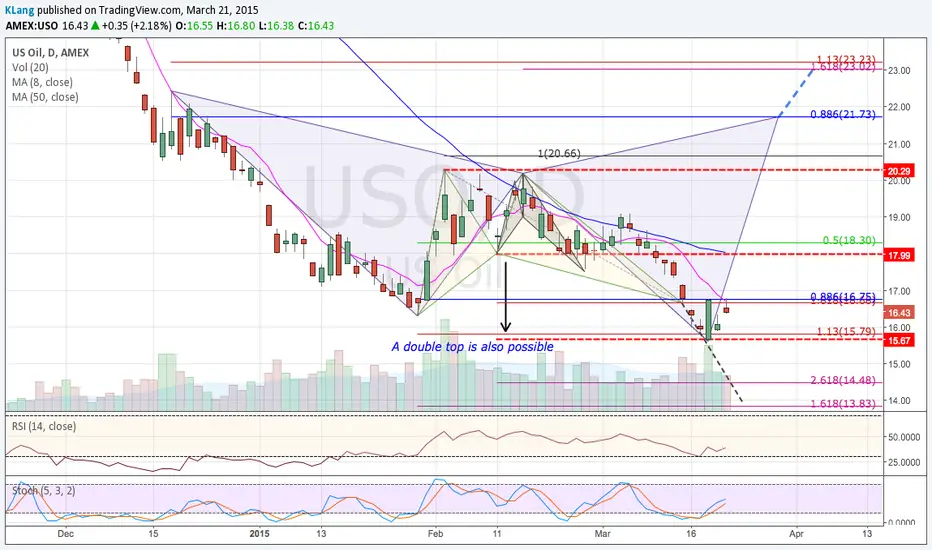
Reducing risk buying into oil through derivativesWell as some have known, I've been salivating of the thought of getting ready to buy into crude oil once again (Last time I ever even thought of that during the early stages of summer 2014 Lol). Derivatives have notoriously had a bad reputation throughout many educational venues, and rightly so. In my belief, they play a crucial role in the reduction of std. deviation within an investment portfolio. Enough preaching though, well here is the trade I'm looking to take, clearly we can see that price is testing a resistance level around the $20.00 area, so an area where I will be looking to enter the position is on a retracement to the Daily 50 Moving Average support, and at the $16.20 area. Along with these positions I will be examining the options (derivative contracts) on the ETF. The position I'm looking to write covered calls at a higher strike to offset price risk I will be subject to in the near term.
Note: Yes there is talk over whether USO or UPL is better to buy, due to contango / backwardation, etc. But for me personally USO is the better buy due to the fact that the near / medium term forward contracts curve is steadily rising, leaving behind the state of backwardation that saw USO lose more value on a percentage basis then UPL. Roughly 12%-14% rise in the curve from this years May 15 Exp. to Feb17 2016 Exp. And with USO selling / purchasing near term contracts, it makes more sense for me to enter a fund rolling over on the month end contracts vs one purchasing contracts farther our in the curve. Once we reach farther our on the curve, I will examine which fund is a better investment. But other than that I'm confidently bullish on oil due to many fundamental factors (To many to write down).
Cheers =)
Disclaimer: I do not feel comfortable calling out trades that I will be taking through derivatives due to their level of risk. If you don't have a good understanding of them I suggest you grab yourself some heavy reading and study hard, and test them out in a demo account before going live with them.

USO 135 Drive PatternPerfect 135 Drive Pattern
Perfect Symetry
Perfect 1.618 Extensions
Low Risk Short IMO


USO short trde opportunity today 4/2/14WTI futures are weak heading into the market open. Expect WTI to regain some of the losses up until the market open, but will sell off the rest of the trading day. Trading the ETF USO, you have a nice Gartly pattern forming with support at the 16.50 level. This has good confirmation with the 707 retracements in the pattern. You can sell the USO, with a stop above 17.88 and a target of 16.40. Assuming an entry at 17.30 your risk / reward would be approximately 2.55 to 1.

USOA Shark is possible. This is a tough chart now with a good deal of resistance. I would not play this, but wanted to put it out there. I do think USO is due for a bounce and is UUP at least stabilizes and trades in a range, USO probably has a chance to move within it's range


CL1!, i smell a rat1st question:
USO vs Crude Oil, seems like no leader and they are twins? Meaning that they share the joys and woes together
2nd question:
USO has broke down its 2009 support while Crude oil has not even tested its 2009 support. What is going on here huh?
I smell a rat
