USO setup for another weekly options expiryEvery Friday we have weekly options expiry and with it comes some interesting price action. If one looks at option open interest data one can glean an idea of where 'the smart money' wants the market to finish at expiration (11AM pst). Interesting here, we see the institutions have a lot of incentive (in terms of net exposure considering they write most options) to take price out above $36 but below $36.50. Additionally, one often gets a 'freebie' trade coming out of the Euro close (8:30AM pst) each of these Fridays. This short pocket of time is ripe for market manipulations and until the public catches on in earnest, i would suggest you try to take advantage of it. If interested in talking more about this market-anomaly or you have questions, please feel free to come to one of my tutorial sessions and we can talk lots about this and other setups.
If my charts help you, or you use my indicators...
please consider a BTC donation to allow me to
continue my work :
1EBttA56cWsgtsZn83VGiNT8si7inZV5Z5
& follow me on Twitter @CRInvestor
USO trade ideas

USO - Today's action reasonabl considering weekly options issuesToday's price action in the popular oil ETF, USO is quite understandable if you look at it from a derivatives perspective. Since the advent of weekly expiration options, one can get a reasonable idea of where institutions want prices to end up at 11:00 AM pst three out of the four Friday's of each month (monthly expiration has a game plan of its own). Today, USO finished at exactly $36.50 on the 11AM bar, do you think that was a mere coincidence???....lol....

Today's TUT - Understanding Friday's Option's expiry setupFriday's are an especially fun day for me because the market often gives you a nice little treat. That being the fact that quite often buying the Euro close and holding into the weekly options expiry can translate into a nice little stack of money for the weekend. Today's price action in USO (Crude Oil ETF) couldn't demonstrate the setup better. The market put in a very clean OTE long sweet spot tag (into the European close) and then reversed violently higher back up into the OTE short zone. Considering most Put options are written by institutions there is a vested interest for the institutions to take price out at/above a certain level. In this case, there was lots of incentive for them to take the market out above $36.50 and that is exactly what they did. Notice too, once the options expiry occurred, the original trend resumed lower.
If my charts help you, or you use my indicators...
please consider a BTC donation to allow me to
continue my work :
1EBttA56cWsgtsZn83VGiNT8si7inZV5Z5
& follow me on Twitter @CRInvestor
Additionally, if you have questions about my indicators feel free to inquire as to when my next Google hangout tutorial session is scheduled so you can ask me in person...
(or go here: www.google.com)

1hr USO - levels to consider trade setupsHere is a 1hr chart on the USO (Oil ETF). At the moment we are in a tough place. Neither at OTE long or short areas so atm I am not considering a trade setup. Should we get back up into the $37 area or down into the low $35 area I shall consider setups then.
If my charts help you, or you use my indicators...
please consider a BTC donation to allow me to
continue my work :
1EBttA56cWsgtsZn83VGiNT8si7inZV5Z5
& follow me on Twitter @CRInvestor
Additionally, if you have questions about my indicators feel free to inquire as to when my next Google hangout tutorial session is scheduled so you can ask me in person...
(or go here: www.google.com)

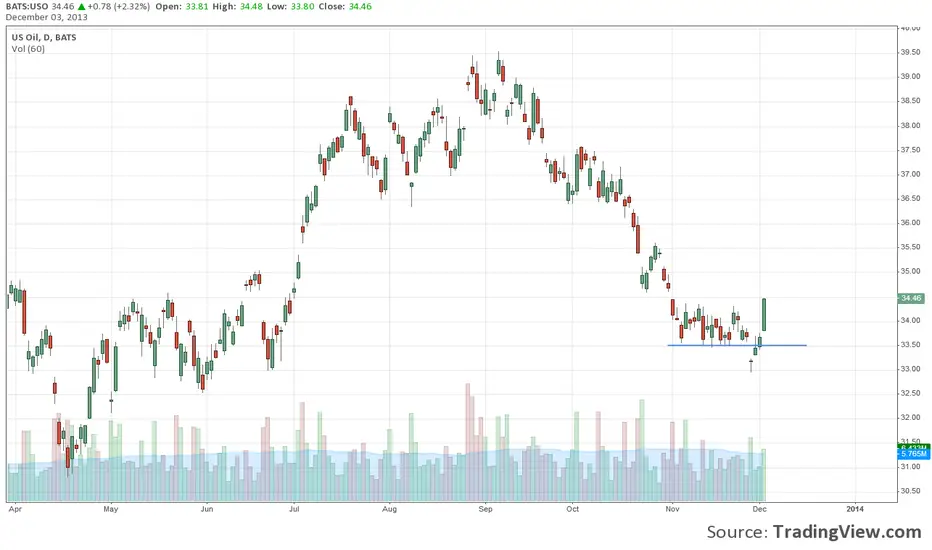
USO - Consolidation after bounceVery similar to CL1!, the oil ETF, USO, is basically consolidating after a nice bounce. Price here worked its way back up into the 37.50 area and is now working its way back into the Optimal Trade Entry (OTE) Long zone around 34.50. At the moment we appear to be in what I would consider a poor trade location area. If we are going to take risks we need to know where our 'I'm wrong' level is and putting a trade on at current levels would imply a very wide risk threshold.....hurry up and wait....
If my charts help you, or you use my indicators...
please consider a BTC donation to allow me to
continue my work :
1EBttA56cWsgtsZn83VGiNT8si7inZV5Z5
& follow me on Twitter @CRInvestor

Time to Short!The uptrend channel seems to end, it's now a good time to short with a good risk/reward ratio.
Our MACDBB still positive but did cross his lower Bolligner Band, so the short is valid.
The SuperTrend still positive, but it should change its polarity soon, and then act as a trailing stop.
Sell Stop around $35.89, target $33.86, stop loss 37.02
But beware, this is USA, very sensitive to major political and economical events, to be use with caution!

4hr USO - fast approaching bull ab=cd targetAs we approach our bull ab=cd target I can't help but notice our Willy21 indicator is suggesting we are over bought once again. Additionally, this last move higher has not been on momentum suggesting a bear divergence is building too.

4hr USO - bullish ab=cd in a little more focusAs is the case on the daily CL1! we currently have a bullish ab=cd harmonic pattern well at work. The price target here ($36.24) appears to be right into a higher time frame OTE short window with the sweet spot being $36.14. I for one shall be watching closely for that level as it will mean a nice AOCO exit on the BoT long established from $34.56. As of Friday, 'stop to trail' level has been hit ($35.48) and one should act accordingly at this point - basically locking in a profit.

4hr USOThe battle between BoT and OTE raged for days it seemed and now we can clearly see BoT longs have surged to their 'stop to trail' level being hit (WTG BoT!). considering how we will soon be moving back into our 'Stupid Over-bought' territory with a move to our bull ab=cd target. Once hit I would be reluctant to be too bullish after that event.

15M USOConsidering higher time short bias, really nice OTE short sweet spot tags on failure in price right on EIA report. Failed rally post report was key. Subsequent 'dead-cat-bounce' gave another opportunity to get short through the post Euro close session.


4hr USOWith notes and levels, OTE short sweet spot tag short working from 96.05. Potential BoT long setup forming


Update: Arctic Cold Favoring Bears? | #USOil #WTIC #Brent #Oil Friends,
A quick "Tech-Note" on #USOil to indicate that the recent rally illustrated in this chart may have had the stomping sounds of bulls, but our system indicates quite the contrary.
In fact, ever since our "Dead-On Hit", a bearish reversal confirmation signal was produced, and we remain quite skeptic as to the ability for price to change that bearish qualifier for the time being. A push above 36.00 is always possible, but the resistance is quite solid at that level.
Instead, we keep our eyes on the bearish levels down below. In fact, we just produced a "Target-Low", TG-Low = 29.90, which marks a potential reversal level. In its path, the secondary target produced last October 28th might require some refinement, but we will keep it as is until price breaks the recent structure low.
Cheers,
David Alcindor | 4xQuad.com
Predictive Analysis & Forecasting
Denver, Colorado USA
---------------------------------
Want more forecasts and cool charts. Join us on TradingView.com: 4xForecaster
Want signals? Follow us on Twitter: @4xForecaster
Our Dead-On Hits Archive: bit.ly
Like Us! on Facebook: www.4xQuad.com
See our recent successful forecasts:
1 - #USDollar: on.fb.me
2 - #AUDUSD: on.fb.me
3 - #NGAS: on.fb.me
---------------------------------

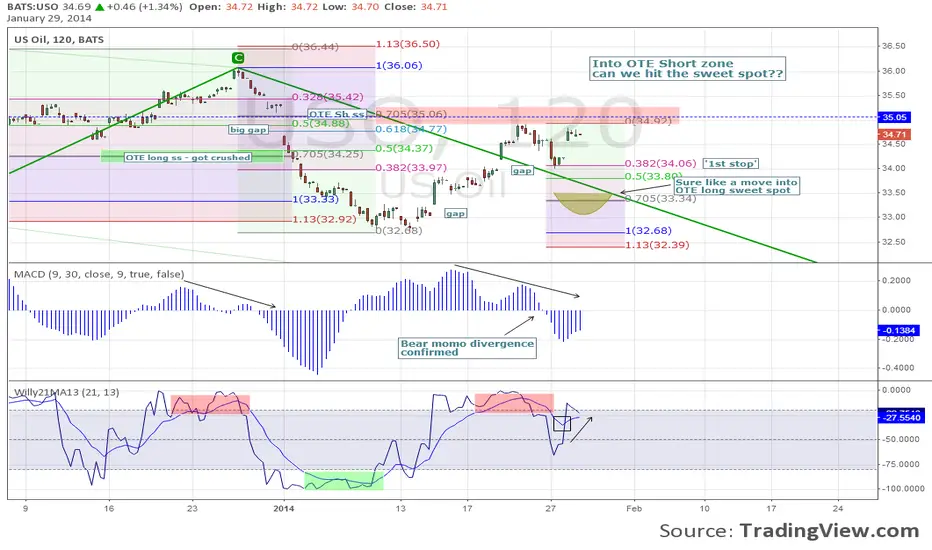
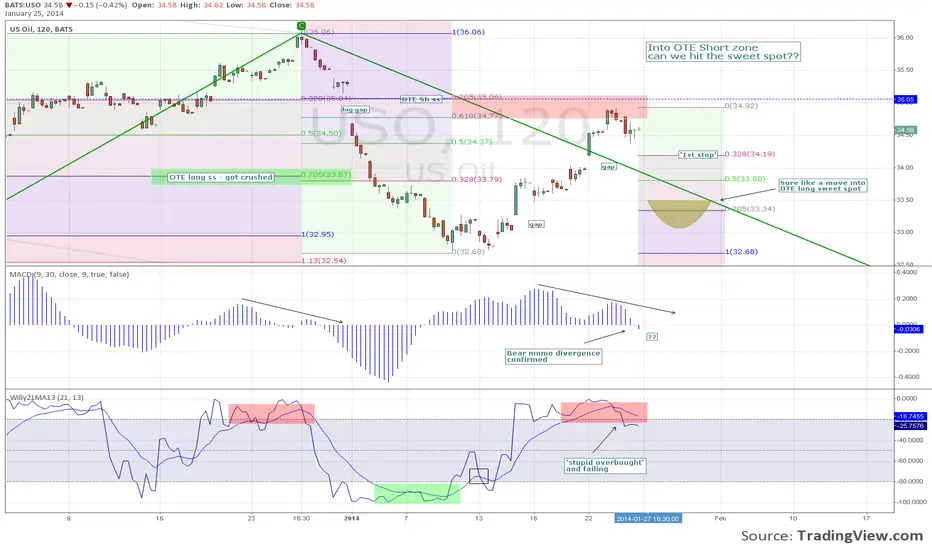
2hr USO for Sat. Jan 26, 2014 for OTE/BoT ShowSince TradingView does not provide intra day data for futures contracts, I will USO (ETF proxy) for my analysis. Here are my levels and notes. Through the week I Tweet T4 screen shares of intra day CL charts.
$USO - Chart Update | #USO #USOil$USO - Chart Update | #USO #USOil
Last October 28th, we defined two distinct targets, namely: TG-1 = 32.96 and TG-2 = 31.60.
TG-1 = 32.96 was hit dead-on, while new structure lows have been carved out over the past 12 hours. TG-2 remains in sight, in force.
Cheers,
David Alcindor | 4xQuad.com

Better sell the bounceBooked profit at 1.62 extension, didn't wait for entire move as CNBC came with the highlight of daily technical for oil just had very bearish signal, MA 50 crosses MA 200. This has been very severe selling, I'd expect people would go short-covering next week. Will see if this fits to next sell. anyway 33-34 is very big support so better be careful than sorry.
Might targeting new low after the bounce but we'll see, if it fails breaking previous bottom if it doesn't I'd look to buy.
Bearish invalid if price violates 35.12


Ooh. Pending middle east/Russia issues???Ukraine was first....of many? Or, Maybe it's just Econ 101.