Oil Does Not Have As Much Downside As Experts Think $USOAfter the Iranian nuclear deal, analysts were all talking about how oil was headed much lower in the short term. Oil barely opened down today and is hovering at $33.74, -0.30 (-0.88%) on the United States Oil Fund LP (NYSEARCA:USO). While the lack of a major drop in oil was surprising to analysis and Wall Street traders, this was no surprise to me. Everyone knew a deal was coming over a month ago and oil has fallen almost non-stop because of it. Essentially, oil had already factored in the Iranian nuclear deal. In addition, oil is more a factor of global economic growth than one country putting out an extra 1 million barrels a day of oil. As economic growth starts to uptick in the coming months, oil should find footing.
I have a master level on the USO which is my buy price at $32.25. There should be a solid swing trade bounce at this before the longer term down trend continues.
Gareth Soloway
Chief Market Strategist
www.InTheMoneyStocks.com
USO trade ideas

28/10 Market Recap.Hello traders!
This week, as analyzed previously, we continued to drift higher by a reasonable pace. Although there has been two days of retracement, this is obviously not enough after the recent uptrend starting on early october. All market participants talk about, and expect a retracement which refuses to come. We witnessed a significant number of participants having a very cautious approach these days about initiating swing positions (few days to few weeks). The consensus, as well as numerous indicator’s overbought levels dictate a behaviour of initiating only near term positions with very tight stops.
Technically speaking, the recent surge in volume adds to the concerns of a near term trend reversal - When volume reaches a peak on a continuous trend, it’s a clear sign that the trend might be over.
Lets have a look at our two basic indicators which always give us a good indication of where the market is headed - DIG Pivot Break and DIG Smart Points. (These indicators are the work of ProTradingIndicators.com and are available within a monthly subscription plan on TradingView)
The first indicator (Pivot Break) tells aus about important tops and bottoms of the underlying asset. The chosen tops and bottoms (Notice that only a select of them are chosen) are very important because they they tell us a lot about the buyers/sellers equilibrium. Each time a green line is being drawn on the chart, it means this level is set as an important resistance level, a level that sellers had a greater strength and overcame the bullish force of the buyers. If, in a certain scenario, the price would come close to that price level from below, we would start considering two outcomes: 1) If the price breaks past that green line, this is a strong sign of the buyers being more aggressive than sellers, and prices are prone to continue the upper movement - Therefore a buy past the green line is an outcome to consider. If on the other hand prices come close to that level and the price action is not decisive - This is a sign that sellers are still on the lead (Or buyers are not that strong) and prices usually tend to fall down - Therefore a sell below the green line is an outcome to consider. Respectively, all of the above logic is valid also for the opposite scenario of a red line - Indicating that Buyers succeeded in pushing the sellers back. In a nutshell, If prices go below the red line, this is a bearish sign and one might consider selling below that level. Additionally, prices flirting with the red line but not breaking it, might be a sign of a resuming buying spree, moving the prices away from that line again.
Disclaimer:Any opinion, analysis, or other information contained under this user is provided as a general commentary and does not constitute investment advice.
Oil & Gas.
As analysed previously, things are not pretty for the USO (Oil & Gas ETF). Prices continue to decline in weak atmosphere regarding the chart. Few support levels were breached, where the last one was the important $35, round number support level.
Mid term analysis supports the continuation of this price decline. We could see a moderation of the current decline around the next support level @ 32.50.
Economic calendar
Nov 4 @ 10:00 AM - Factory Orders.
Nov 6 @ 10:00 AM - Leading Indicators.
Nov 7 @ 08:30 AM - GDP.
Nov 8 @ 08:30 AM - Unemployment Rate.

10/21 Market Recap.Hello Traders!
Although last week the market didn’t move much, we still drilled up just to set record highs over and over again. This is quite understandable regarding the last fierce up weeks we had lately, but it seems that the market is feeling quite comfortable on this rally and looks to continue that, maybe with a different pace.
Let’s talk technical. Plotting the DIG_SmartPoint and the DIG_Pivot Break (These indicators are the products of ProTradingIndicators.com, available at TradingView within a monthly subscription) will reveal to us a text book uptrend chart, higher highs, higher lows, almost symmetrical moves repeating themselves over and over again. Despite the natural tendency to see a chart like this and scream “Overbought!”, we have to look on and rely upon the information that is handed to us through the chart. Yes, we are very extended, for a long period of time, but on the other hand there was also decent profit taking phases and overall the uptrend looks healthy.
On the Pivot Break, we have gone past the green line indicating a resistance level of the previous high pivot. This is obviously a Bullish sign. One concern though, is that since the low pivot of $164.50 (and the lower band of the DIG_SmartPoint) the prices have not retraced a notch, obviously, this retracement should come sooner or later, but the concern is that farther the prices go for a longer time without a retracement, deeper will be the retracement. For those of you who look for the most probable scenario, we can look at the recent resistance break as the last considerable milestone, turning into support. Within this week we should see a retracement back to that support level, and hopefully a bounce. If this scenario will materialize, the odds of the market turning back violently diminishes.
On another note, it is also very important is to see the numbers that came out, as we are in the earnings season. Given that 69% of all companies that reported earnings so far beat the analysts estimate (!). This is a very encouraging number for both the economy, the longer time frame investors and the market traders. We still have some numbers of big companies (Like Apple) that should come in and set the tone, but the idea is clear - The economy is in a very good condition, unemployment rates are not that horrible and earnings are setting records. Within that ecosystem, the recent fierce market rally comes down to a simple logic explanation, the market is in good shape and people think that at these price levels stocks are still a cheap asset.
Oil & Gas.
Our scenario of last week regarding the weakness of the USO (Oil ETF) has materialized in a form of the break of the $36.40 level, causing a steady price decline down to the $35.00 mark. This support level, which is a combination of multiple highs occurring early this year and the psychological effect of the 35 round number did the trick and held prices above. One thing to look at is the volume pattern in which the last 3 green days formed, which is a declining pattern. This volume pattern is not so bullish and might even tell us that the recent upmove is just a small correction, so that further downside action is probably the outcome for the short term.
Economic Calendar - This week we have some important numbers coming out.
Oct 29 08:30 AM - PPI.
Oct 29 10:00 Am - Consumer Confidence.
Oct 30 08:30 AM - GDP.
Oct 30 08:30 AM - CPI.


#USOil - Two NEW Bearish Targets - #USO #oilUSOil - Two NEW Bearish Targets
TG-1 = 32.96
and
TG-2 = 31.60
4xQuad


WTI-Brent Spread ShortWTI/Brent spread up to $11 today I had big short last year @ 24
Loooking for a move back down to $3 by the end of the year but
expecting news of early take up of Keystone pipeline."
The market has quickly accepted Libya output but failed to
appreciate how delicate the situation there is the PM having
just been kidnapped and works only back to work a month.

23/9 Market RecapHello Traders!
This week the market experienced a mediocre decline, this decline is a continuation of the - apparently false - 171 breakout that happened two weeks ago. Of course, after such a thrust upward, it is only healthy for the market participants to realize some gains, but on a technical point, we would prefer to see a slower motion rather than the fast decline earlier last week. A point of optimism is that the down volume was on a decline regarding the positive momentum of the up volume.
As for the near support level, we are actually sitting on one - 167.50 - this level is both a low DIG Pivot and a high DIG Pivot from previous price swings (For more information on DIG Pivots Indicator, please refer to ProTradingIndicators.com website. Available on TradingView for $29/Month). Apart from being a double pivot level, this area of 167.50 is where two gaps occurred during the past month, which adds up to its importance. The next super important support level happens to be at the next low DIG pivot at 163. This level is in fact a bouncing point from the upper trend channel which formed since early 2013. Breaking that level downward will probably trigger a consolidation period, or worse, a decline phase.
As for resistance levels the job is much easier since we are at all time highs and the recent decline implies the near resistance level of 173.50. Between those 2 important levels of 173.50 and 163 there is much room for the market to “digest” the recent bull run, as always, we will keep a close eye on the market for further development.
Metals & Oil
It looks like the USO, the Oil & Gas ETF, has lost direction in some way. It has been over a month that the price wanders between farther and farther price levels without a clear direction. This price action implies that there is no fixed balance between buyers and sellers, but the opposite, for now there is no “leader” for that market and it seems that the boundaries of the current situation are 39.50 as the upper bound and 36.30 as the lower bound.
As it happens, USO is currently slightly above the 36.30 lower bound - 36.85 - a bearish sign for now, but the nature of these technical formations dictate that the boundaries could widen up, meaning that new lows and new highs will be set - Still with no clear direction of the trend.
GLD on the other hand acts like it’s heading back to a bearish picture. Prices fall fast with high volume makes us believe that the recent break through the negatively sloped channel was just a momentary profit taking. For now, an important support level should be watched, the level of 124. Breaking this level on the down side will set a new down trend as we will inaugurate a series of lower highs and lower lows.
Economic Calendar:
Oct 1 @ 10:00 AM - Consumer spending.
Oct 3 @ 10:00 AM - Factory orders.
Oct 4 @ 08:30 AM - Unemployment rate.

USO 3m analysis - short heading into the weekendOil prices were very soft coming out of weekly options expiry and heading into the weekend. There was considerable open interest in the $37.00 put options (4k) so if those holders were exercised then there ought to be a bit of stock overhanging the market through the coming sessions. As the close of Friday approached a 3m 'BoT' short setup developed. While I am unable to hold onto positions through the weekend, it is relevant to at least respect what the market is telling us. Indeed, if I had my druthers, I would like to be short from the $37.03 area with a stop just above $37.15 (13 ticks risk) and a target of $36.68 (35 ticks potential reward). Ideally, I would prefer to have on 2 cars and cover one at indicated target while leaving the remaining 'freebie' on with a stop at b/e and a target based off the higher time frame analysis....

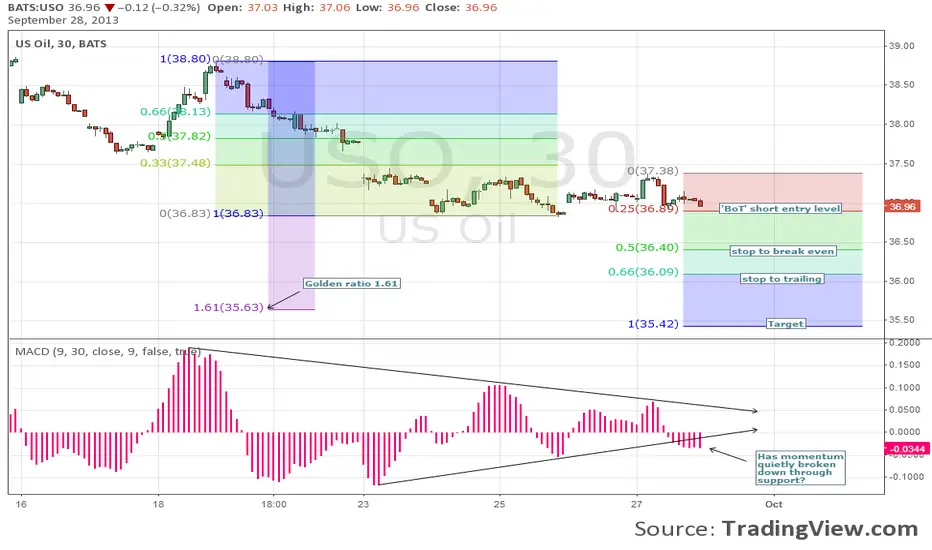
USO 30m analysis - sharp bear flag points to violent spike lowerOil prices looks a bit bearish in the near term. While just outside of our text book 'BoT' trade setup criteria (counter trend rally was less than required 33%) one can make the legitimate argument for a short on a move through the bottom of the recent trading range. Higher time frame analysis suggests there is more downside potential and momentum in the near term has quietly slipped through its uptrend line support. If this is indeed a new bear ab=cd pattern forming, 'BoT' model levels suggest a short at $36.89 with a stop just above $37.38 and a target of $35.42 (49 ticks risk for 147 ticks reward). Since this is a bit of risk, one might want to look at the very short term charts as we seem to have a 3m 'BoT' short setup working at the moment too (please refer to 3m analysis for more on that). Should you be able to put on 2 cars at the 3m 'BoT' trade level, look to take profits on half the position at 3m targets levels but shoot for the 30m targets on the remaining 'freebie'...
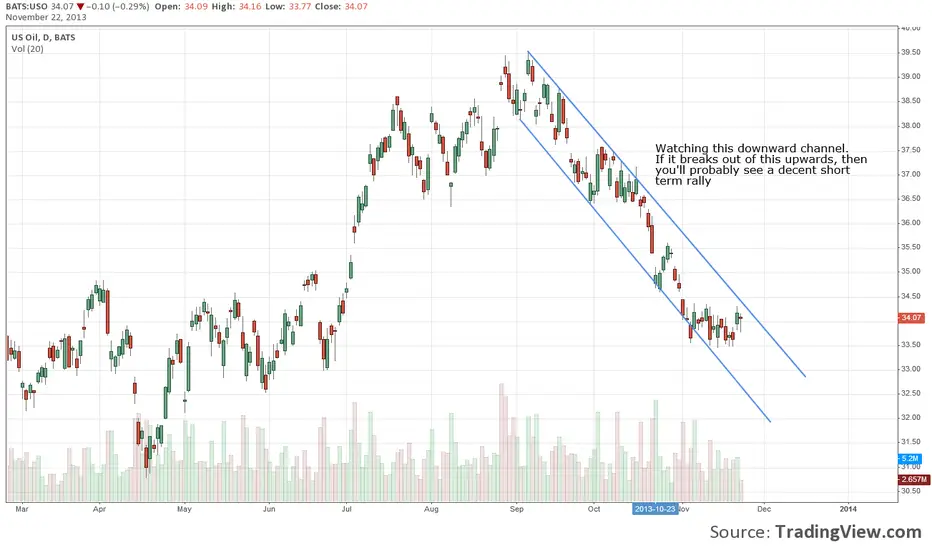
USO - 4hr analysis: Slowly working down to Fibonacci targetsFrom a four hour perspective oil prices (as represented here through the ETF - USO) have now been trending lower for two weeks. The peak into Friday the 13th (and its subsequent failure the following Monday) confirmed a broader market downturn as our time tested 'trending' indicator (that being the relationship between the 13ema and the 30sma) turned negative. That failure also confirmed a bearish 3bar candle reversal pattern, a Head & Shoulders top pattern and a 'bot' short trade setup. That top was also confirmed by momentum as our MACD Histogram has slowly made lower highs and lower lows since that event.
So if the market had indeed topped, where should we be looking for that correction to take us. A natural pullback of the rally coming out of the June lows suggests three significant short term technical targets.
1. Our '1st stop' 38.2% Fibonacci level
2. Our 2nd target 'the 50% rule'
3. Our Ultimate target a 70.5% retrace into the 'OTE Long Sweet Spot'.
After gaping lower, price spent a good portion of the past week flirting with the underside of our '1st stop' target (37.39). This repeated rejection (the last one came on a touch of the 13ema) suggest the 37.39 area may now be significant resistance. Interestingly, it also sets up a new shorter time frame 'BoT' short opportunity (please refer to USO 15m analysis for information on that). Since the 200sma and the significant low of August (36.35) sit right at our 2nd target, 'the 50% rule', I am fairly comfortable with the idea price will visit this area in the not too distant future.
Ultimately, I expect the oil market to work its way down into the OTE long sweet spot neighborhood (34.92) before it can start its seasonal bottoming process ('buy when it snows, sell when it goes'...and all that). That area also corresponds with that shorter time frame 'BoT' short setup target too. How exactly we get there is of course anyone's guess but the setups and targets are in place.


USO 15m analysis - hurry up and chopTrading oil over the past two weeks has been an exercise in frustration. While Geo political tension ebb and flow, price has basically gone nowhere. We ended August in the low 38.00 area and have basically oscillated around that level since. While we did finish the week with a 15m 'BoT' long setup confirmed and working, I am not holding out a lot of optimism for the trade going forward. Yes, I think our 'move stop to trail' level ought to get hit (suggesting we ought to walk away from this long trade with some profits) but I am not holding my breath for a whole heck of a lot after that. My hunch here is we do another 'stop run' to take out weak shorts above 39.00 then roll back over - lets see what happens....

USO - 3m OTE & BoT long tradesText book panic open leads to gap fill. Two possible entries. 1. OTE long ss touch (on severe momentum divergence) when market tested open 2. BoT long setup on momentum confirmation with oversold W%R.

USO Psychological LevelsThese Fibonacci levels are important to consider when trading USO, specially the levels 0.382, 0.5 and 0.618. As always use different techniques when trading to increase your probabilities/odds. Cheers!!!

USO 120M - last gasp into seasonal peak?USO finally hit the long standing 200% range extension target with its latest push to new highs. Considering seasonality issues, it shouldn't surprise us too much to see this last move higher was on divergent momentum and seems to have failed to recapture a key uptrend line. After a sharp little pullback recently, a test of those highs seems realistic given momentum's short term stance and the fact that if this is indeed a significant top, some sort of 'M' or double top price pattern really should be in order. Regardless, current OTE buying levels are substantially lower than where we are at present. I for one shall be reluctant to be too bullish until we are beyond this historically tough time of year for asset prices in general and hopefully back into those OTE levels.

USO 15m analysis - Dead-cat-bounce into resistance, now what? Considering the bullish momentum divergence coming into today's session it shouldn't have surprised anyone to see us move our way higher today. That divergence seems to have played itself out as the resolution of the current wedge pattern will probably dictate trade going forward. As for price action itself, it is interesting to see how we played with yesterday's two highlighted down trend lines through today's session. First we opened right at the initial, then after a substantial pullback, worked our way ultimately up to the second. Fascinating too, both the pull back from the open and the subsequent rally filled gaps left on the chart. Once the gaps were filled, the moves literally stopped on a dime - both times, remarkable. I have expected the first week or two after the Labour Day weekend were going to be quite volatile - I didn't expect this!

USO 15m analysis - Long slow march back to OTE long sweet spotWhile it looked for a brief window of time like the bulls were trying to control, with the break of the significant low of 38.20 it would appear as though the bear seem to still be in the driver's seat. The standing targets for the current pull back have been first a test of the 38.2% fib level (38.65) and then an ultimate move back towards the OTE Long Sweet Spot (37.74). As outlined in today's chart, the break of 38.20 sets up a short term ab=cd pattern that also paints a target in and around that OTE level. I for one shall be keeping an eye out for that target to be hit through the next session or two.

USO 3Minute 'BoT' long setup taken todayHere is a long trade I did today (through CL futures) expressed in USO terms. This is an excellent 'base hit' trade as the 1.5 reward to 1 risk level was achieved by simply moving my stop to trailing (in USO's case I find a 10 cent trailing level works rather well). I was flushed out at a nice healthy profit on the double top failure later on in the session.

USO 15m Anaysis - She bounced and then stalledIn a most interesting turn of developments, the previously mentioned key low of $38.21 did turn out to be a significant pivot point for USO. I say this because the US stock market was closed through Monday yet futures markets were trading. Crude Oil itself did violently gap lower through the Sunday evening session but by time today's retail trading rolled around prices had rebounded. So much so, USO actually gaped higher to start today off - go figure. Because of this odd trading, I still do believe we need to have USO itself trade down into that OTE Long Sweet Spot and maybe today's price action has set that move up. Specifically, we rallied through the early part of today's session (I was able to get one long trade off and took 36 ticks by going long at 107.84 and exited on a trailing stop at 108.20) up into resistance (the previously mentioned potential bull 'bot' formation key entry level and hourly trend line) and then promptly failed. The failure can clearly be seen in the momentum indicator as we actually finished the day with a negative reading there. While it is far too early to call a 'top', I shall be watching tomorrow's session for signs of that top and a potential trade down into the larger time frame OTE L SS zone.

USO 15m analysis - the politicans may have put in a bottomAfter hitting my first downside target (38.2% retrace of the move up from $37.00) prices continued to work their way lower. They ultimately touched the 200sma, the 50% retrace level and came within 1 penny of touching the old breakout higher at 38.20. Prices violently reversed and momentum promptly shifted to the bulls as word that both the Sec. of State and then shortly after that, President Obama would be speaking on the recent concerns coming out of the Middle East. Mr. Kerry's comments garnered the most attention as prices violently spiked higher and then quickly retreated once he was done. It would seem the geo-political 'risk' of being too short was just too great as the swing had many hallmarks of a 'stop run' in that it both failed to break the previous highs (38.84) nor did it change our 'trending' indicator (that being the relationship between the 13ema and the 30sma) which was/is still pointing down. Put it all together and while we are still pointing lower, one can't help but feel we are closer to the end of this move, not the beginning. While I am not totally convinced we have 'bottomed' just yet, I have included a potential 'Bot' long setup on this chart to give you an idea of where I am looking for this market to go once it does find buying support.

USO Bearish GartleyUSO popping based on the recent Syria turmoil. These moves always get faded. It is in a perfect Bearish Gartley. Looking for a retrace somewhere in the $36.40 range.
