Key stats
About ProShares Ultra 7-10 Year Treasury
Home page
Inception date
Jan 19, 2010
Structure
Open-Ended Fund
Replication method
Synthetic
Dividend treatment
Distributes
Distribution tax treatment
Ordinary income
Income tax type
Capital Gains
Max ST capital gains rate
39.60%
Max LT capital gains rate
20.00%
Primary advisor
ProShare Advisors LLC
Distributor
SEI Investments Distribution Co.
UST is a leveraged play on the intermediate portion of the US Treasury yield curve, providing (2x) exposure to the daily returns of an index of US Treasury securities with 7 to 10 year years remaining in maturity. Targeting this pocket gives UST significant interest rate sensitivity, and sets it apart from the many funds that target 1 to 10 year Treasury securities. As a geared product with daily reset, UST is not a buy-and-hold investment, and should not be expected to provide index leverage return greater than one day period. That also means that trading costs matter much more here than fees, and on this front UST could have some vulnerabilities. Investors should pay close attention to its daily trading characteristics to determine if it has enough liquidity to support same-day entry and exit. Prior to October 14, 2016, UST tracked Bloomberg Barclays U.S. 7-10 Year Treasury Bond Index. The change has minimal impact on investors' exposure.
Related funds
Classification
What's in the fund
Exposure type
Cash
Bonds, Cash & Other100.00%
Cash100.00%
Top 10 holdings

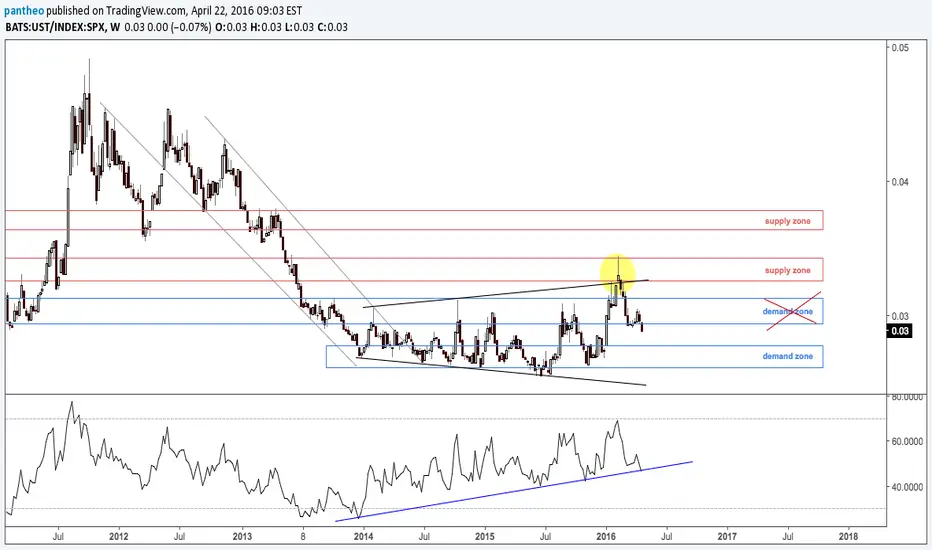

UST/SPX:BONDS/STOCKS RATIO BREAKING OUT?Price kept coming down inside this down trending channel for the last two years.
1,618 area gave two long entries, first being the most successful so far and second being the most safe and low risk due to double bottom and bullish divergence at the end of March.
Major obstacle now, after broke the
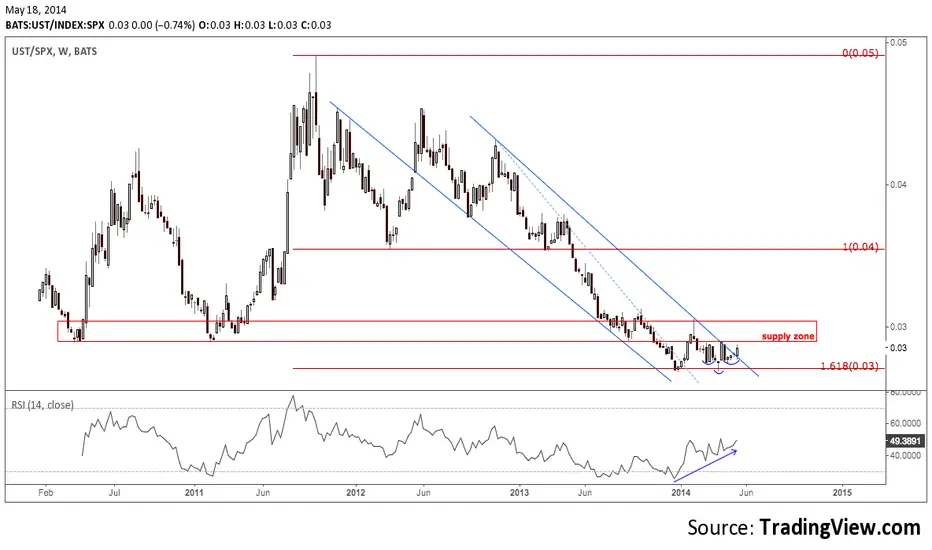
Possible double bottom at 1,618 for bonds/stocks ratioPrice has been contained in the downtrending channel for a couple of years now.
Possible double bottom at 1,618 fib, looks like Adam and Eve, but measuring the the distance from left (A) and right edge (C) to middle peak of Feb 2nd bar (B) can be Eve & Eve at the end, which has better success rate.

See all ideas
Summarizing what the indicators are suggesting.
Oscillators
Neutral
SellBuy
Strong sellStrong buy
Strong sellSellNeutralBuyStrong buy
Oscillators
Neutral
SellBuy
Strong sellStrong buy
Strong sellSellNeutralBuyStrong buy
Summary
Neutral
SellBuy
Strong sellStrong buy
Strong sellSellNeutralBuyStrong buy
Summary
Neutral
SellBuy
Strong sellStrong buy
Strong sellSellNeutralBuyStrong buy
Summary
Neutral
SellBuy
Strong sellStrong buy
Strong sellSellNeutralBuyStrong buy
Moving Averages
Neutral
SellBuy
Strong sellStrong buy
Strong sellSellNeutralBuyStrong buy
Moving Averages
Neutral
SellBuy
Strong sellStrong buy
Strong sellSellNeutralBuyStrong buy
Displays a symbol's price movements over previous years to identify recurring trends.
Frequently Asked Questions
An exchange-traded fund (ETF) is a collection of assets (stocks, bonds, commodities, etc.) that track an underlying index and can be bought on an exchange like individual stocks.
UST trades at 42.28 USD today, its price has risen 0.47% in the past 24 hours. Track more dynamics on UST price chart.
UST net asset value is 42.28 today — it's fallen 0.78% over the past month. NAV represents the total value of the fund's assets less liabilities and serves as a gauge of the fund's performance.
UST assets under management is 17.46 M USD. AUM is an important metric as it reflects the fund's size and can serve as a gauge of how successful the fund is in attracting investors, which, in its turn, can influence decision-making.
UST price has fallen by −0.96% over the last month, and its yearly performance shows a −2.65% decrease. See more dynamics on UST price chart.
NAV returns, another gauge of an ETF dynamics, have fallen by −0.78% over the last month, showed a −0.59% decrease in three-month performance and has decreased by −0.08% in a year.
NAV returns, another gauge of an ETF dynamics, have fallen by −0.78% over the last month, showed a −0.59% decrease in three-month performance and has decreased by −0.08% in a year.
UST fund flows account for 1.35 M USD (1 year). Many traders use this metric to get insight into investors' sentiment and evaluate whether it's time to buy or sell the fund.
Since ETFs work like an individual stock, they can be bought and sold on exchanges (e.g. NASDAQ, NYSE, EURONEXT). As it happens with stocks, you need to select a brokerage to access trading. Explore our list of available brokers to find the one to help execute your strategies. Don't forget to do your research before getting to trading. Explore ETFs metrics in our ETF screener to find a reliable opportunity.
UST invests in cash. See more details in our Analysis section.
UST expense ratio is 0.95%. It's an important metric for helping traders understand the fund's operating costs relative to assets and how expensive it would be to hold the fund.
Yes, UST is a leveraged ETF, meaning it uses borrowings or financial derivatives to magnify the performance of the underlying assets or index it follows.
In some ways, ETFs are safe investments, but in a broader sense, they're not safer than any other asset, so it's crucial to analyze a fund before investing. But if your research gives a vague answer, you can always refer to technical analysis.
Today, UST technical analysis shows the sell rating and its 1-week rating is sell. Since market conditions are prone to changes, it's worth looking a bit further into the future — according to the 1-month rating UST shows the sell signal. See more of UST technicals for a more comprehensive analysis.
Today, UST technical analysis shows the sell rating and its 1-week rating is sell. Since market conditions are prone to changes, it's worth looking a bit further into the future — according to the 1-month rating UST shows the sell signal. See more of UST technicals for a more comprehensive analysis.
Yes, UST pays dividends to its holders with the dividend yield of 3.54%.
UST shares are issued by ProShare Advisors LLC
UST follows the ICE BofA US Treasury (7-10 Y). ETFs usually track some benchmark seeking to replicate its performance and guide asset selection and objectives.
The fund started trading on Jan 19, 2010.
The fund's management style is passive, meaning it's aiming to replicate the performance of the underlying index by holding assets in the same proportions as the index. The goal is to match the index's returns.