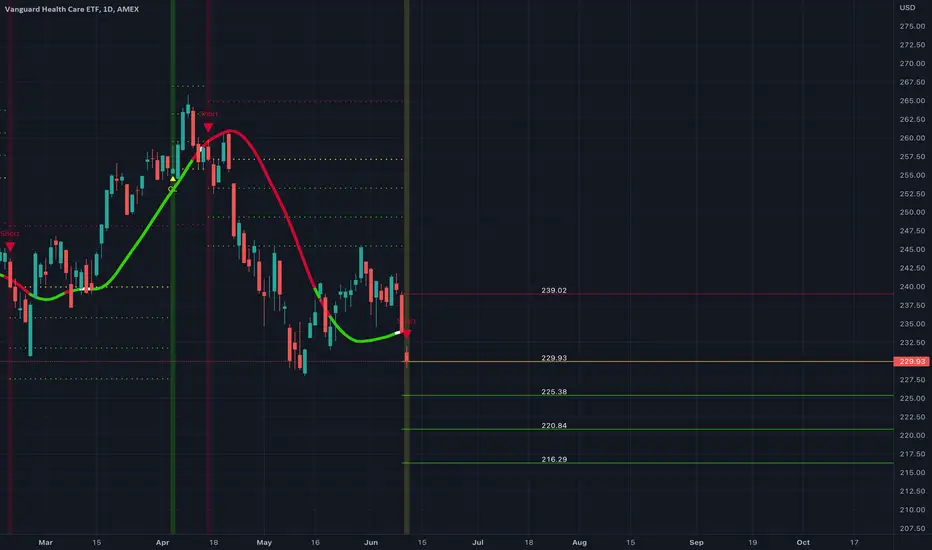
Heathcare hitting new 52 week highs Heathcare is one of the only sectors really breaking out but looking to be shifting to more of a topping pattern like most of its peers
Key stats
About Vanguard Health Care ETF
Home page
Inception date
Jan 26, 2004
Structure
Open-Ended Fund
Replication method
Physical
Dividend treatment
Distributes
Distribution tax treatment
Qualified dividends
Income tax type
Capital Gains
Max ST capital gains rate
39.60%
Max LT capital gains rate
20.00%
Primary advisor
The Vanguard Group, Inc.
Distributor
Vanguard Marketing Corp.
The fund offers broad exposure to healthcare companies in the US. It holds firms that stretch across multiple industries from the broadly defined healthcare space. This includes healthcare provider and services companies, healthcare equipment and supplies manufacturers and distributors, healthcare technology firms, and companies involved in the research, development, production, and marketing of pharmaceuticals and biotech products. The funds large basket stems from its total market universe. Holdings are weighted by market capitalization and are diversified by applying limits on regulated investment companies, such that no group entity exceeds 25% of the index weight and the aggregate weight of issuers with over 5% weight in the index are capped at 50% of the portfolio. The index is rebalanced quarterly.
Related funds
Classification
What's in the fund
Exposure type
Health Technology
Health Services
Stock breakdown by region
Top 10 holdings

VHT & Healthcare coiling up falling RSI big move incomingI do not hold VHT but instead the vanguard healthcare mutual fund as a play on an undervalued sector of the market. Many key holdings are down 40+% including Pfizer and I believe this is a great hedge for a recession in the coming 2-3 years. I have used this VHT chart to help with my entries around

VHT $VHT Health Care Initial ShortVHT $VHT Health Care Initial Short. TP and SL on chart. Move SL on TP. After TP2, trail with 0.5ATR step and 1.5ATR offset.
VHT - Retests Former SupportThe Vanguard Health ETF hit a well-established level of former support (current resistance). Fibonacci levels also indicate a level of resistance around $249. The temporary upwards move looks like a kickback, a retest of that former support, and the stock will likely begin to move lower in coming we

VHT at a good level to add to investmentVHT is the ticker for Vanguards healthcare ETF that seeks to track the MSCI US IMI Health Care Index. I use this ETF as part of my long term investing strategy to gain exposure to the US healthcare sector which I believe will experience greater growth and lower drawdowns then the general market over

$VHT new all time highVHT hit new all time high on thursday. if we can get 1 or 2 more days of consolidation this sets us up for a nice move higher

Evolution of VHTThe actual evolution of VHT looks the same as the end of 2018? ... maybe 173 will be a good support, we will maybe see VHT touching this support couple of times before breaking 194.86 and then reaching 210.40 on the first or the second quarter of 2021?

Vanguard Healthcare ETF at SupportTook this one in my IRA with Vanguard today. Price has been mingling with the 50 Day EMA but looking to catch this cross-over early on the re-test of support.

Healthcare - A few % up and then large correction.
Very narrow channel for 4 years.
Obamacare story? Let me know if you know.
Subjective but if a new marginal high, I read 17waves up from oct11.
100 is calling - that is a decent correction ahead.

See all ideas
Summarizing what the indicators are suggesting.
Oscillators
Neutral
SellBuy
Strong sellStrong buy
Strong sellSellNeutralBuyStrong buy
Oscillators
Neutral
SellBuy
Strong sellStrong buy
Strong sellSellNeutralBuyStrong buy
Summary
Neutral
SellBuy
Strong sellStrong buy
Strong sellSellNeutralBuyStrong buy
Summary
Neutral
SellBuy
Strong sellStrong buy
Strong sellSellNeutralBuyStrong buy
Summary
Neutral
SellBuy
Strong sellStrong buy
Strong sellSellNeutralBuyStrong buy
Moving Averages
Neutral
SellBuy
Strong sellStrong buy
Strong sellSellNeutralBuyStrong buy
Moving Averages
Neutral
SellBuy
Strong sellStrong buy
Strong sellSellNeutralBuyStrong buy
Displays a symbol's price movements over previous years to identify recurring trends.
Frequently Asked Questions
An exchange-traded fund (ETF) is a collection of assets (stocks, bonds, commodities, etc.) that track an underlying index and can be bought on an exchange like individual stocks.
VHT trades at 245.82 USD today, its price has fallen −1.36% in the past 24 hours. Track more dynamics on VHT price chart.
VHT net asset value is 249.43 today — it's risen 0.07% over the past month. NAV represents the total value of the fund's assets less liabilities and serves as a gauge of the fund's performance.
VHT assets under management is 15.33 B USD. AUM is an important metric as it reflects the fund's size and can serve as a gauge of how successful the fund is in attracting investors, which, in its turn, can influence decision-making.
VHT price has fallen by −1.45% over the last month, and its yearly performance shows a −9.97% decrease. See more dynamics on VHT price chart.
NAV returns, another gauge of an ETF dynamics, showed a −0.36% decrease in three-month performance and has decreased by −6.87% in a year.
NAV returns, another gauge of an ETF dynamics, showed a −0.36% decrease in three-month performance and has decreased by −6.87% in a year.
VHT fund flows account for −1.26 B USD (1 year). Many traders use this metric to get insight into investors' sentiment and evaluate whether it's time to buy or sell the fund.
Since ETFs work like an individual stock, they can be bought and sold on exchanges (e.g. NASDAQ, NYSE, EURONEXT). As it happens with stocks, you need to select a brokerage to access trading. Explore our list of available brokers to find the one to help execute your strategies. Don't forget to do your research before getting to trading. Explore ETFs metrics in our ETF screener to find a reliable opportunity.
VHT invests in stocks. See more details in our Analysis section.
VHT expense ratio is 0.09%. It's an important metric for helping traders understand the fund's operating costs relative to assets and how expensive it would be to hold the fund.
No, VHT isn't leveraged, meaning it doesn't use borrowings or financial derivatives to magnify the performance of the underlying assets or index it follows.
In some ways, ETFs are safe investments, but in a broader sense, they're not safer than any other asset, so it's crucial to analyze a fund before investing. But if your research gives a vague answer, you can always refer to technical analysis.
Today, VHT technical analysis shows the strong sell rating and its 1-week rating is sell. Since market conditions are prone to changes, it's worth looking a bit further into the future — according to the 1-month rating VHT shows the neutral signal. See more of VHT technicals for a more comprehensive analysis.
Today, VHT technical analysis shows the strong sell rating and its 1-week rating is sell. Since market conditions are prone to changes, it's worth looking a bit further into the future — according to the 1-month rating VHT shows the neutral signal. See more of VHT technicals for a more comprehensive analysis.
Yes, VHT pays dividends to its holders with the dividend yield of 1.60%.
VHT trades at a premium (0.04%).
Premium/discount to NAV expresses the difference between the ETF’s price and its NAV value. A positive percentage indicates a premium, meaning the ETF trades at a higher price than the calculated NAV. Conversely, a negative percentage indicates a discount, suggesting the ETF trades at a lower price than NAV.
Premium/discount to NAV expresses the difference between the ETF’s price and its NAV value. A positive percentage indicates a premium, meaning the ETF trades at a higher price than the calculated NAV. Conversely, a negative percentage indicates a discount, suggesting the ETF trades at a lower price than NAV.
VHT shares are issued by The Vanguard Group, Inc.
VHT follows the MSCI US IMI 25/50 Health Care. ETFs usually track some benchmark seeking to replicate its performance and guide asset selection and objectives.
The fund started trading on Jan 26, 2004.
The fund's management style is passive, meaning it's aiming to replicate the performance of the underlying index by holding assets in the same proportions as the index. The goal is to match the index's returns.