VOO trade ideas

VOO is at a discounted priceVOO is at a nice price to make tons of profit. Down about $55 from high. Is a steady investment doesn't do anything crazy.


S&P 500: Head-and-Shoulders Top•A key assumption is that the right shoulder is not exceeded. Nonetheless, this seems unlikely given the likelihood of negative fundamental events relating to the economy and earnings .
•Much like the Nikkei 225 crash of 1989, the 100 MA's could end up stopping the bounce dead in its tracks. Hence, it's very possible that consolidation will continue in the 2700-2800 range for some time.
•Shoulder levels are not just arbitrary: 50% Fibonacci Retracement mirrors several prior crashes, including the Nikkei 225 in 1989, the S&P 500 in 2008, and the Dow Jones in 1930.

VOO - Pivot pointFor now at least, we have found a pivot point for this SP500 ETF, at the 50% fib retrace level. Huge volume and a quick turnaround in price, we shall see how this one turns out. Compare Volume to late 2018, our targets for a bounce from this level are at 88% Fib extension level of $290, all time high of $312 (100%), and perhaps $372 at the 161.8% extension level.
This can still drop, there is a lot of news creating a small panic, and if so we may get to see the dead cat bounce. For me, volume is key.


$VOO $SPY S&P500 Potential Running Flat Wave 2I've been seeing many bear charts lately but many of the large-cap stocks that make up the S&P500 have already made big corrections in the previous Wave 4 of a higher degree back in December. It's true that the Wave 4 correction in the SPY was fairly shallow, but 0.236 - 0.386 are still high probability areas.
Many of the bear counts for the S&P are valid EW counts but until price action changes, I believe this current explanation has a higher probability of playing out.

Daily VOO stock price trend forecast analysis18-Jul
Price trend forecast timing analysis based on pretiming algorithm of Supply-Demand(S&D) strength.
Investing position: In Rising section of high profit & low risk
S&D strength Trend: About to begin an upward trend as a adjustment trend gradually gives way to increasing limited falls and strong rises.
Today's S&D strength Flow: Supply-Demand strength has changed to a strengthening selling flow when stock market opening.
read more: www.pretiming.com
Forecast D+1 Candlestick Color : GREEN Candlestick
%D+1 Range forecast: 0.4% (HIGH) ~ -0.2% (LOW), 0.2% (CLOSE)
%AVG in case of rising: 0.7% (HIGH) ~ -0.1% (LOW), 0.5% (CLOSE)
%AVG in case of falling: 0.1% (HIGH) ~ -0.6% (LOW), -0.3% (CLOSE)


VOO Market OutlookWave 5 looks to be in with bearish divergence on 30 minute. Looking for a retracement to 0.5 or 0.618 before starting Wave 3.

VOO S&P 500 ETFAdapted from some other charts for the S&P index, as well as CNBC analyst Todd Gordon, this is a simple play to profit off a possible inverse H&S pattern in the coming months. If we see a test of the Ichimoku cloud on this ETF we can expect a break above the cloud and a possible re-test of all-time highs. This is tricky though, because we are trading below the 200 MA and this pattern looks eerily similar to the H&S pattern in March 2018, where we were trading above the 200 MA but went down to touch the 200 MA. See link below.
www.cnbc.com
For personal use only, not trading advice.

VOO Levels - 11.11.18Could open either way here - but needs a sizable bounce to break through the descending trend lines as current volume continues to lead pressure down.

Work smarter not harder.Glorious buy signals for the VOO. I believe we track upwards towards another sell off around Dec-Feb. Price target of 268-275 for an exit. I would be hesitant to ride this to new AHs. In the same breath, I'll be placing rainy day funds in here. Cheers
Potential Juicy LevelsI think it's time we pay for those tax cuts we already gave to all the companies that own all these shares, isn't it? This could get ugly fairly quickly. Jan will decide if the rally is back on or if we are heading towards new lower levels.

Resistance and Support Levels VOO October 2018The VOO has broken several key levels of support this month on heavy volume and is looking much more probable to re-test lows from as far back as April before re-testing the highs from September. Even if the trend line from April holds, which is looking less likely by the day, we won't be back to September levels until May 2019 at earliest.
Resistance Levels are Red and Key Expected Support Levels / buy targets in Green.

VOO Bounce backLooking for a bounce around 263.15 to the 10-day SMA(yellow). Bounce could start as low as 262 on our first fib retracement

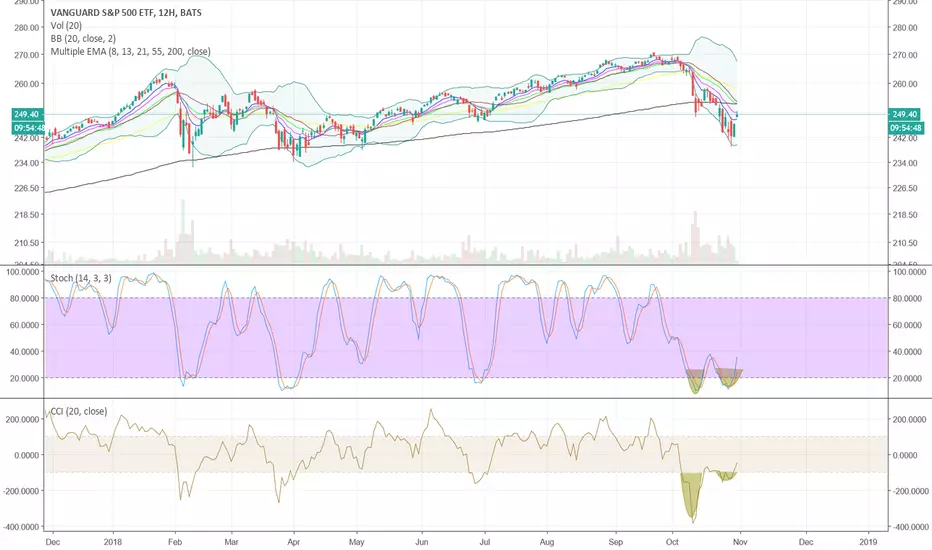
$VOO Short Term Bearish - Indicators heavy - Double Top$VOO Seems to be having trouble breaking through the resistance and forming a double top, in the mean time the indicators are getting heavy and turning down, MACD is turning bearish.
Fear of trade war + little money inflow = BAD


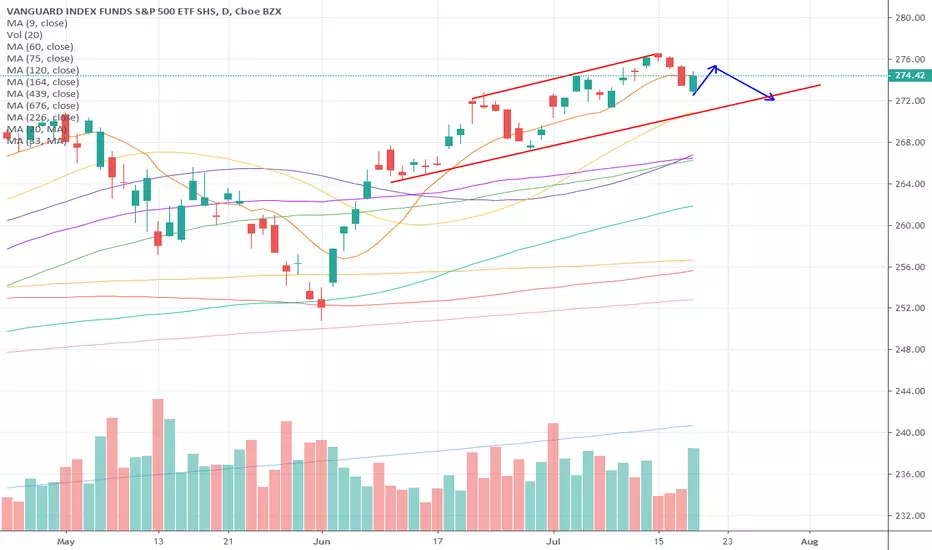
VANGUARD S&P 500 ETF - BEARISH ASCENDING WEDGEVANGUARD S&P 500 ETF - BEARISH ASCENDING WEDGE
Pattern already closed in April 2018


Vanguard long term shortsBased in the long term tf's I'm confident we will see new lows,
lets see how it goes.
just and idea, please like or comment.
thanks.
