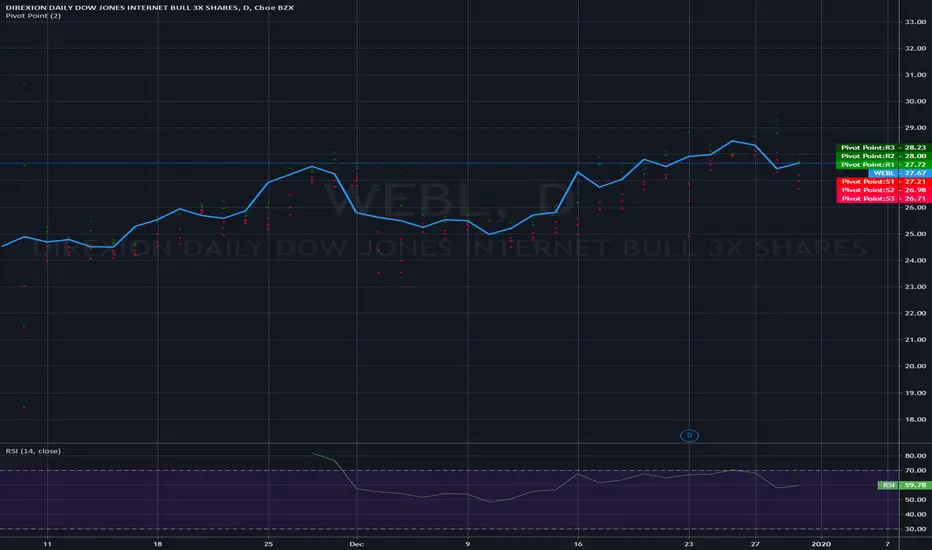
WEBL Long - ETF breaks ~$20 resistance after 2 years.AMEX:WEBL breaks $21 after 2 years.
Been holding from $13 since 2022.
Up-bound !!!
Key stats
About Direxion Daily Dow Jones Internet Bull 3X Shares
Home page
Inception date
Nov 7, 2019
Structure
Open-Ended Fund
Replication method
Synthetic
Dividend treatment
Distributes
Distribution tax treatment
Ordinary income
Income tax type
Capital Gains
Max ST capital gains rate
39.60%
Max LT capital gains rate
20.00%
Primary advisor
Rafferty Asset Management LLC
Distributor
Foreside Fund Services LLC
WEBL is passively managed to provide 3x leveraged daily exposure to the Dow Jones Internet Composite Index. The index is composed of the 40 largest and most actively traded U.S. internet technology and commerce companies. Companies selected are determined by the Index Provider to derive a majority of their sales from activities such as online retail, social media, advertising, travel platforms, cloud computing or digital marketing. Because of daily rebalancing and the compounding over time, the return of the Fund for periods longer than a day, will very likely differ from 300% of the return of the Index over the same period.
Related funds
Classification
What's in the fund
Exposure type
Technology Services
Retail Trade
Cash
Stock breakdown by region
Top 10 holdings

We Bull!The Dow has to make a new ATH and to do it these stocks have to join the party.
Unemployment rate climbs as DOW makes ATH, then rate cuts will cut the DOW in half over next year.

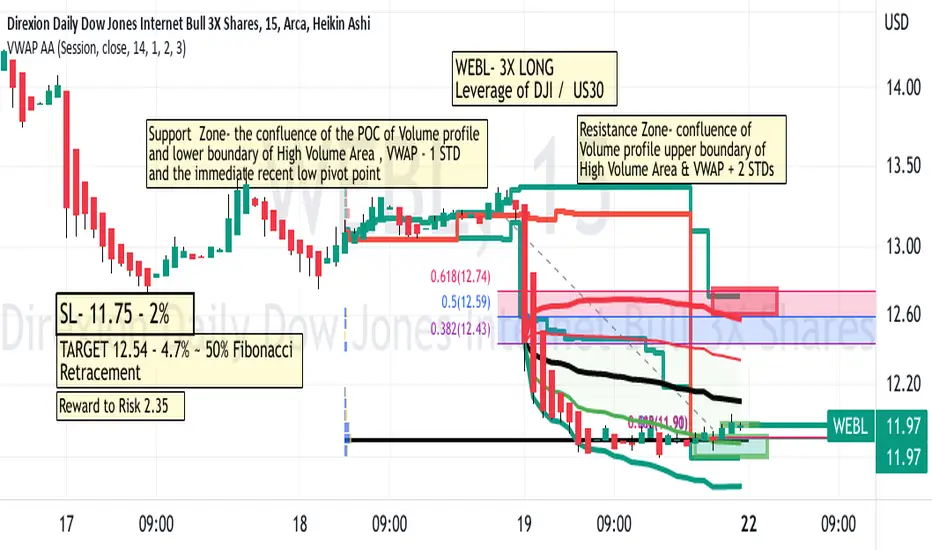
WEBL 3X LEVERAGE DOW JONES LONGAMEX:WEBL
The WEBL moves well owing to its leveraging.
At present on the chart, WEBL is near support
after a downtrend. I have picked a target
based on a retracement of that downtrend
to the middle Fibonacci level. This target
also has confluence with the VWAP band
and the upper boundar
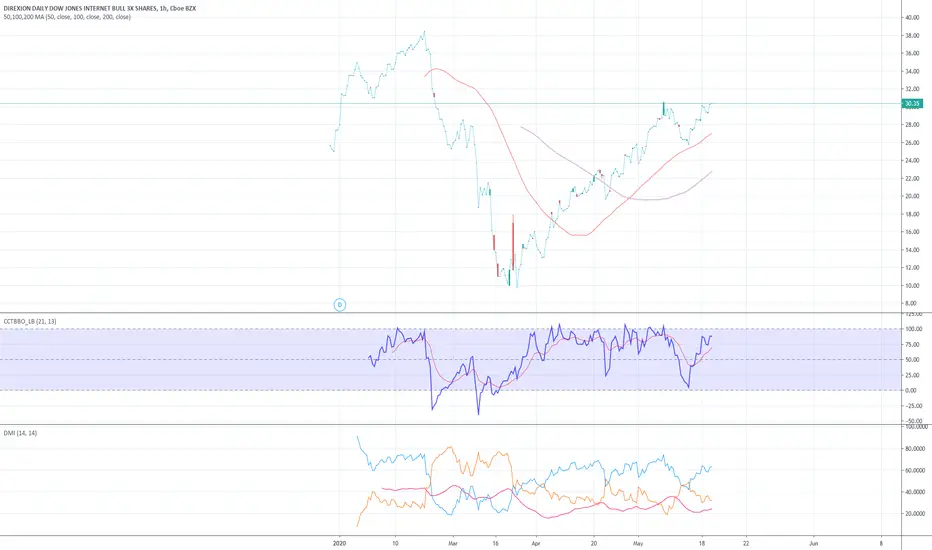
Mid-term upswingI do know nothing about this etf.
But I think it will go up because of technicals.
I will be right if I am lucky.
Let's see if I am luckly


DIREXION: New 3x ETF Poised for Gains in 2020This is a brand new (about 2 months old) leveraged ETF that was brought-about recently that looks fairly promising in my opinion for 2020. Many of the stocks in this etf actually have significant promise in 2020 and many of them consolidated in 2020 and actually have the potential to "grow" and "cat
See all ideas
Summarizing what the indicators are suggesting.
Oscillators
Neutral
SellBuy
Strong sellStrong buy
Strong sellSellNeutralBuyStrong buy
Oscillators
Neutral
SellBuy
Strong sellStrong buy
Strong sellSellNeutralBuyStrong buy
Summary
Neutral
SellBuy
Strong sellStrong buy
Strong sellSellNeutralBuyStrong buy
Summary
Neutral
SellBuy
Strong sellStrong buy
Strong sellSellNeutralBuyStrong buy
Summary
Neutral
SellBuy
Strong sellStrong buy
Strong sellSellNeutralBuyStrong buy
Moving Averages
Neutral
SellBuy
Strong sellStrong buy
Strong sellSellNeutralBuyStrong buy
Moving Averages
Neutral
SellBuy
Strong sellStrong buy
Strong sellSellNeutralBuyStrong buy
Displays a symbol's price movements over previous years to identify recurring trends.
Frequently Asked Questions
An exchange-traded fund (ETF) is a collection of assets (stocks, bonds, commodities, etc.) that track an underlying index and can be bought on an exchange like individual stocks.
WEBL trades at 28.06 USD today, its price has fallen −9.86% in the past 24 hours. Track more dynamics on WEBL price chart.
WEBL net asset value is 28.09 today — it's fallen 2.76% over the past month. NAV represents the total value of the fund's assets less liabilities and serves as a gauge of the fund's performance.
WEBL assets under management is 163.59 M USD. AUM is an important metric as it reflects the fund's size and can serve as a gauge of how successful the fund is in attracting investors, which, in its turn, can influence decision-making.
WEBL price has fallen by −2.16% over the last month, and its yearly performance shows a 68.43% increase. See more dynamics on WEBL price chart.
NAV returns, another gauge of an ETF dynamics, have risen by −2.76% over the last month, have fallen by −2.76% over the last month, showed a 29.98% increase in three-month performance and has increased by 74.61% in a year.
NAV returns, another gauge of an ETF dynamics, have risen by −2.76% over the last month, have fallen by −2.76% over the last month, showed a 29.98% increase in three-month performance and has increased by 74.61% in a year.
WEBL fund flows account for −77.68 M USD (1 year). Many traders use this metric to get insight into investors' sentiment and evaluate whether it's time to buy or sell the fund.
Since ETFs work like an individual stock, they can be bought and sold on exchanges (e.g. NASDAQ, NYSE, EURONEXT). As it happens with stocks, you need to select a brokerage to access trading. Explore our list of available brokers to find the one to help execute your strategies. Don't forget to do your research before getting to trading. Explore ETFs metrics in our ETF screener to find a reliable opportunity.
WEBL invests in stocks. See more details in our Analysis section.
WEBL expense ratio is 0.98%. It's an important metric for helping traders understand the fund's operating costs relative to assets and how expensive it would be to hold the fund.
Yes, WEBL is a leveraged ETF, meaning it uses borrowings or financial derivatives to magnify the performance of the underlying assets or index it follows.
In some ways, ETFs are safe investments, but in a broader sense, they're not safer than any other asset, so it's crucial to analyze a fund before investing. But if your research gives a vague answer, you can always refer to technical analysis.
Today, WEBL technical analysis shows the sell rating and its 1-week rating is buy. Since market conditions are prone to changes, it's worth looking a bit further into the future — according to the 1-month rating WEBL shows the buy signal. See more of WEBL technicals for a more comprehensive analysis.
Today, WEBL technical analysis shows the sell rating and its 1-week rating is buy. Since market conditions are prone to changes, it's worth looking a bit further into the future — according to the 1-month rating WEBL shows the buy signal. See more of WEBL technicals for a more comprehensive analysis.
Yes, WEBL pays dividends to its holders with the dividend yield of 0.24%.
WEBL trades at a premium (0.09%).
Premium/discount to NAV expresses the difference between the ETF’s price and its NAV value. A positive percentage indicates a premium, meaning the ETF trades at a higher price than the calculated NAV. Conversely, a negative percentage indicates a discount, suggesting the ETF trades at a lower price than NAV.
Premium/discount to NAV expresses the difference between the ETF’s price and its NAV value. A positive percentage indicates a premium, meaning the ETF trades at a higher price than the calculated NAV. Conversely, a negative percentage indicates a discount, suggesting the ETF trades at a lower price than NAV.
WEBL shares are issued by Rafferty Asset Management LLC
WEBL follows the DJ Internet Composite. ETFs usually track some benchmark seeking to replicate its performance and guide asset selection and objectives.
The fund started trading on Nov 7, 2019.
The fund's management style is passive, meaning it's aiming to replicate the performance of the underlying index by holding assets in the same proportions as the index. The goal is to match the index's returns.