Sector Rotation Strangle - Long Bio, Short Specialty RetailThis is a complex play that involves a lot of risk and the use of options on both ETFs and Stocks.
Goal: Capture the apparent sector rotation activity between Biotechnology and Specialty Retail.
I have been waiting quite some time for these two sectors to start playing out the way they ought to, based on earnings across the board and common sense.
I see LULU's miss as the final act before the fringe players in the retail space get hammered down.
I have also been waiting for biotech to turn, as it has been stagnant for quite some time. I think getting into VRTX is wise, as it is one of the top players in the space and just got a nice price upgrade.
Meanwhile, while longing VRTX and XBI (bio ETF), I plan on buying a put position in URBN (worst specialty retailer) and XRT (specialty retail ETF.
Again, very risky play given the current market environment, but the tape tells me this will work.
Let's see.
AMEX:XBI AMEX:XRT NASDAQ:VRTX NASDAQ:URBN
XBI trade ideas


Biotech - 3rd Time is a charm?What I see...
+ Long hammer that closed above 10ma
+ 50ma has just crossed above the 200ma
+ Prices have just broke above the neckline of a head and shoulder pattern
+ RSI is flat at 59.2
+ MACD is below the signal line but in bullish territory
+ 10ma continues to play Support role
- Bearish engulf on -1d bar
- Today's vol. is lesser than -1d
What I setup...
+ Long entry above today's high
- Stop under today's low
+ Target at 1.613 fib
:: Duration - 2 to 3 weeks
* Comments and Likes are appreciated; Subscribers are oil rich! *

BioTech - I want to get in!** Comments and Likes are appreciated; New Subscribers are excellent! **
What I see..
+ I tried to get into XBI last week but got stopped out
+ Friday's bar painted a bullish kicker with a strong close above 10ma
+ MACD is bullish but merged
+ RSI at 63
+ Bollinger is narrowing...
- Immediate resistance at all-time high
- 50ma is still under 200ma
- MACD appears to be turning south
What I setup...
+ Long entry above Wednesday's high
- Stop at last week's low
+ Target at .618 Fib
:: Duration - weeks to months!

BIOTECH. Bigger the base bigger the raiseThis will rocket ship until the corrections in July/September buy now sell then. Wait for correction buy again.
I am longing this. Arguably best sector to be in a covid world.

Is BioTech ETF Set for a Rally?* Comments and Likes are appreciated *
What I see...
+ Head and Shoulder pattern started forming as early as Dec
+ Found Support back in mid-March
+ Tested $100 neckline and pulled back to the .786 Fib
+ Last week, prices retested the neckline and consolidated in a side way move painting 2 NR7 bars
+ MACD is flat but in positive territory
+ RSI is at 64 after bouncing off of 50
- Prices pulled away from 10MA
- 50MA is still under the 200MA
What I setup...
+ Long above neckline
- Stop under last week's channel low
+ Target is 618 Fib


XBI LongBiotech stocks looking strong, a lot have made new highs already. XBI looks like it's gonna follow suit. Old high is at the top purple line. That's the first target, after that is price discovery. Indicators are looking good and price is converging. Should see a pop or drop in the next few days. Only was I see a drop is if the market itself takes a dump.

XBI Potential What is XBi?
XBI provides exposure to one of the broadest portfolios among US biotech ETFs. The fund equal-weights its portfolio, which in turn emphasizes small- and micro-caps and greatly reduces single-name risk. Thus, the weighted-average market cap is much smaller than some competitors. Unlike other funds in this segment, XBI is a pure biotech play, with relatively small pharma overlap as we see it. This highly efficient fund, which charges less than competing funds, has a history of beating its index due to revenue from securities lending. It has attracted a large asset base and trades with excellent volume. The fund’s alternative take on the space earns it a place on our Opportunities List.
Looking like we could see a pull back here or breakout.
Risk and reward is in our favor here. if it rejects, it can go to $95 area, if it breaks out, we can just stoploss for $1.


S&P Biotech vs. S&P PharmaceuticalsThe 2 strongest industries within HC - would like to see momentum confirm the move higher.


OPENING: XBI MARCH 20TH 80/105 SHORT STRANGLE... for a 1.75 credit; delta .60/theta 3.57.
Notes: Selling the 15's with the intent to add to delta balance if necessary. Since this is shorter duration than some of my other broad market or exchange-traded fund stuff, I may go for the full 50% max, but will see how it goes. I would note that this is generally less liquid than I like to see (.20 wide markets).

XBI Wave 3 or not 2 bAs part of my Elliot wave study i c this potential Formation of wave 3 . Can u c it 2?

XBI - Bull Flag BreakoutLook for biotech stocks to start performing well. Price targets are noted on the chart. Bollinger Band shows a squeeze in this area as well.


XBI testing Resistance this upcoming week!TICKER: $XBI
XBI will be testing daily resistance $97.00. The nasdaq biotech $IBB already broke its daily resistance so can XBI follow along?
Again, dividend distribution was this week and it has an impact on the price.
However, I would still be caution because the weeky RSI is pretty extended. RSI is @ 71ish and historic pullback RSI level is around 72.
Weekly time frame is extremely extended and a break of the higher low every weekly candlestick pattern will be the first indication of consolidation.
I am very interested in looking for a swing trade of LABD because of how extended the bulls are.

XBI Cypher CompletesXBI Blew through the completion point on this daily Cypher. The sector is strong no doubt about it but is due for a pause.
I will be looking at some Bear Call spreads first thing tomorrow AM if this gets one more parabolic push off the open.

XBI potential pull back next weekTicker: $XBI
The biotech sector have been on absolute fire these couple of weeks. Check out the weekly chart with higher lows every candlestick.
The daily chart is getting toppy with somewhat of a double top at $96.61.
Break $94.08 this upcoming week and that will signal weekly consolidation. I will be scouting for a bearish play with LABD this upcoming week.
Weekly RSI also approach oversold so that means be cautious bulls.

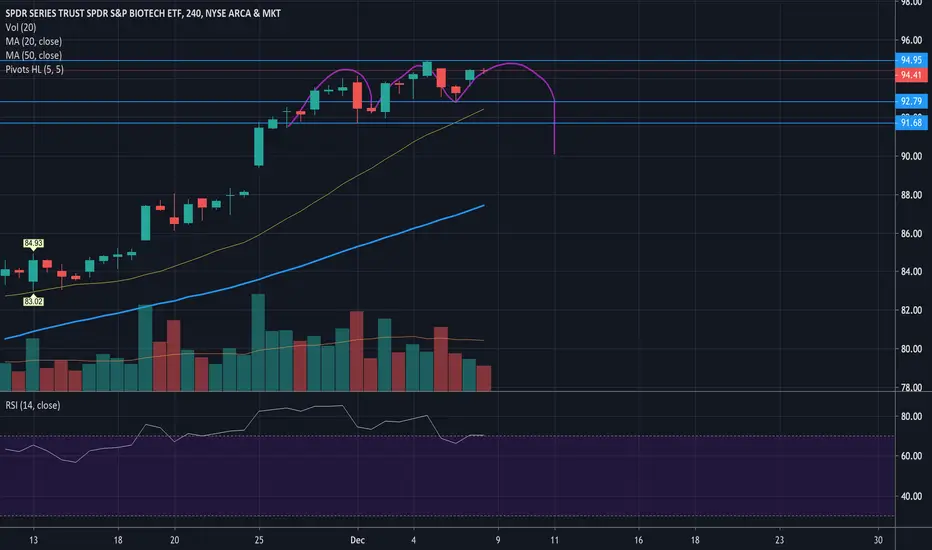
XBI could potentially break out hardTicker: $XBI
XBI needs to break 94.95 to break out hard. If we reject and form a 4 hour lower high compared to 94.95, WATCH OUT FOR THE 4H INVERSE HEAD AND SHOULDERS with support for 92.97 and 91.68!!!
Also watch for market correlation. If market is strong and hits ALL TIME HIGH, XBI could be in a great position to go long.

Technicals versus PolicitiansWIth Warren and Bernie fading a bit, Bio/health have jumped nicely. Too much too soon IMO, at the minimum a short term pull back is coming. I am hoping we can become more range bound in the technicals and return to cyclical trading between 78 and 87, this type of cycle is great IBB and XBI, however getting caught when it breaks down can hurt! I use XBI has my measure, but trade LABU and LABD.
**Short XBI via LABD
