XBI - Long term profit ?XBI - long term profit ? A famous index, descending trendline break out, above the 150 moving average line, high volume.
Only an idea and not a recommendation for trading!
XBI trade ideas

Opening: XBI Jan '25 77 Covered CallComments: This started out as an October 20th 76 short put (See Post Below) and then proceeded to crater quite massively, resulting in early, random assignment of shares. In an attempt to get my cost basis immediately within earshot of where the underlying is currently trading, I went extremely long-dated and sold the Jan '25 77 for 7.05 against my one lot, resulting in a cost basis of my original short put strike at 76 minus the 7.05 I received for the short call or 68.95 relative to today's closing price of 67.07.
The Jan '25 77 short call finished the day at around 43 delta, and -- as with all my covered calls, I'll look to roll out the short call at intervals, with an eye toward keeping the short call at or above the 30 delta and/or leaving it alone if price pops back above my break even.
Unfortunately, the position becomes somewhat "dead money" for a bit since the current next available expiries to roll to are limited to June '25, Dec '25, and Jan '26 (although I can certainly roll down intraexpiry if push comes to shove).

BiotechBiotech companies contribute significantly to the development of the health sector. But investing in biotech companies has its fair share of risk. They can be profitable when milstones are achieved but catastrophic when something goes wrong.
Through an ETF, an investor has a safer entry into the biotech space where risk and reward is shared across a long list of other companies in the sector. This ETF has 137 biotech companies in its holdings.
We are looking at adding the SPDR biotech ETF in our portfolio for the long-haul.

XBI setting up for Bear pivotXBI is testing +2 sig from the last range selloff. There was fair respect for the Average on black line but the high value seller did not return at +1 sig.
So now at +2 sig I don't think it's likely the seller returns aggressively enough for a push down.
The much longer timeframe seller got filled in July at +1 at the Red line and has continued to sell. If the program still has more capital to sell it could cause a sideways maket enough to sell 86 or 88 strike depending on where the credit on risk is. Probably more like 86/88 spread.
But 88/90 would be preferable because the near term selling range would have been exceeded at that point and it wouldn't make sense to be +4 sig on the near term out of range. The higher range would take precedence at +2 sig green line.
Personally, it "looks" like it's extending and reaching up to engage liquidity, not return to any value area extreme and continue a trend. And I "think" that liquidity is trolling for engagement around 81.25 at the moment.

Rolling (IRA): XBI November 17th 71 Short Put to January 19th 70... for a .65 credit.
Comments: Originally opened this for .77 (See Post Below); rolling down and out for a .65 credit. Total credits collected of 1.42.
I may still get assigned, but at a slightly better price than were I to just have left it alone.

Opening (IRA): XBI December 15th 63 Short Put... for a .70 credit.
Comments: Targeting the <16 delta strike paying around 1% of the strike price in credit. Basically, just building a position here on this weakness.

XBI Compared to TLT using 1 MONTH 30 MIN DPO 63TRADE THIS
XBI long when the DPO is above the 0 line. XBI short when crossing below the 0 line. Using it to compare to TLT provides a sentiment overlay: Higher TLT is risk-with lower implied interest rates; Lower TLT is risk-off with higher implied-interest rates. XBI is the most interest rate sensitive as the index contains the least amount of dividend paying stocks and benefits the most in a lower interest rate environment. Therefore, XBI and TLT should maintain inverse correlation.
Using both TLT and XBI with DPO should provide price direction guidance
FUNDAMENTALS
XBI is an exchange-traded fund (ETF) that tracks the performance of the S&P Biotechnology Select Industry Index. It includes companies in the biotechnology sector, which is known for its volatility and potential for high growth.
TLT is an ETF that aims to track the performance of the ICE U.S. Treasury 20+ Year Bond Index.
TLT is composed of long-term U.S. Treasury bonds. It is often used as a gauge for investor sentiment and economic outlook.
Detrended Price Oscillator (DPO):
The Detrended Price Oscillator is a technical indicator that helps identify cycles and overbought/oversold conditions in a market. It calculates the difference between a past price (usually the closing price) and a moving average of the price over a specified period.
The DPO is useful for identifying short- to medium-term cycles or trends by removing the longer-term trend from the price. If you are using a DPO of 63 periods, it means you are looking at the detrended price movements over the last 63 days (or whatever time frame you're using).
A positive DPO value indicates that the current price is above the historical average, suggesting a potential uptrend. A negative DPO value suggests that the current price is below the historical average, indicating a potential downtrend.
IMPACT
To compare XBI to TLT using DPO, you would look at the DPO values for both XBI and TLT over the same time period (63 days). The comparison of DPO values can provide insights into the relative strength or weakness of the trends in biotech stocks (XBI) compared to long-term Treasury bonds (TLT) during that period.

$XBI - risk reward looks goodAMEX:XBI Biotech has been beaten up for the past 2 years. If you zoom out it looks like it is forming a gigantic head and shoulder pattern.
It has bounced every time it is around $63 - $60 area which is the neckline region.
I think the risk reward at this point is attractive. If it breaks below $60 though, things can get ugly.
Upside targets:
$79
$91
$110
Downside risk:
$60

Opening (IRA): XBI January 19th 55 Short Put... for a .61 credit.
Comments: Adding a rung to beaten-down biotech at strikes better than what I currently have on in October at the 76, November at the 71, and December at the 63, targeting the <16 delta strike paying around 1% of the strike price in credit.
I'll be assigned shares on the 76 here shortly (and possibly the 71), after which I'll proceed to sell call against.

Opening (IRA): XBI Dec/Feb 57/50 Short PutsComments: Adding a couple rungs to my XBI position at strikes better than what I currently have on, targeting the <16 delta strike paying around 1% of the strike price in credit.
December 15th 47: .62 credit
February 16th 50: .57 credit
I would've also gone with January, but already have a rung on at where I'd want to pitch my tent.

Symmetry Trading on XBISymmetry Trading on XBI forming a broad head and shoulders on the daily chart.
Lets see if comes to reality.
Selling LABU and buying LABD.

Opening (IRA): XBI October 20th 76 Short PutComments: Looking to sell the around the 30 delta here in the October monthly, which is more aggressive than I usually go, but am fine with taking assignment, selling call against if it comes to that.
Currently, the strike is bid 1.45/ask 1.65 with a 1.55 mid, so will look to get a fill "in that neighborhood."
Just looking for some "engagement" in this broad market, low IV environment with my standard go-to's (IWM, QQQ, SPY) at 17.8%, 18.8%, and (ugh) 13.6%, respectively for their 30-days.

XBIXBI might seem cheap since it has dropped almost 60% since its peak. Don't worry...it'll keep getting cheaper


Biotech Breakdown? $XBIHere we are looking at AMEX:XBI I am looking at an hourly chart with a renko chart on the ATR setting just to keep it simple. A huge wedge has been developing on XBI for awhile now and we have made a breakdown on the bottom trendline. We are currently at a line in the sand on XBI and either the bulls can hold it up or we really breakdown on this final support and make our way down to the low of last year. The final support zone is at $74.50 to roughly $73.00. If we break below $73 I would look out below as there could be a big unraveling as this pattern has been developing for awhile now. The technical price target witch is the width of the wedge at the point of the breakdown is showing a 16% drop from where prices are now which would lead us right down to the low of last year. In my opinion this is a long term investment and not a trade I would happily DCA but I am cautiously bearish and want to get a better price. I am currently holding out whatever I have and plan to really start buying once we get into the mid $65 range.

Opening (IRA): XBI November 17th 71 Short Put... for a .77 credit.
Comments: Targeting the shortest duration <16 delta short puts paying around 1% of the strike price in credit to emulate dollar cost averaging into the biotech exchange-traded fund.

$XBI - Bounced from lower trend lineAMEX:XBI bounced from lower trend line. MCAD, RSI and William R% all curling up. It could head to $87.
Targets:
- $82
- $87
Key resistance area: $82.
Key support area: $76.
Like and follow me for more charts and trade ideas.

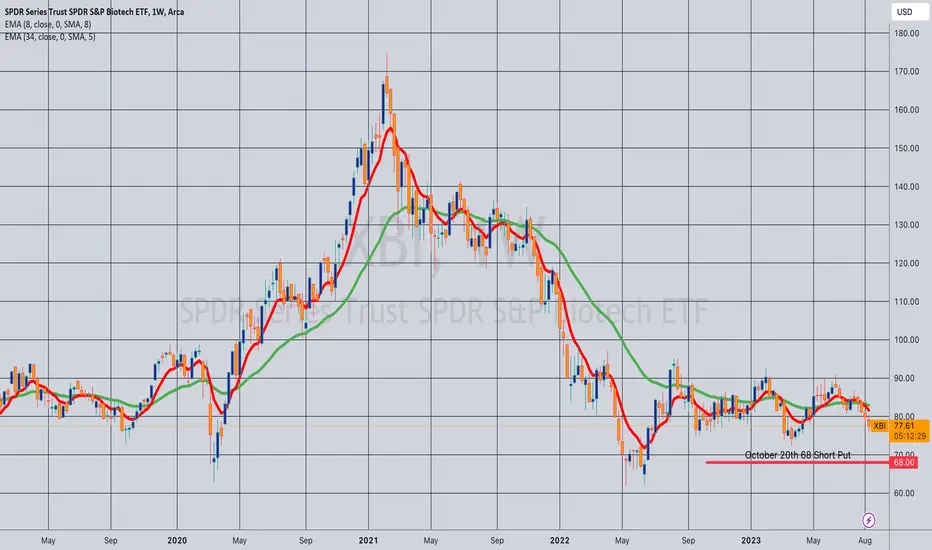
Opening (IRA): XBI October 20th 68 Short Put... for an .82/contract credit.
Comments: Targeting the <16 delta strike paying around 1% of the strike price in credit to emulate dollar cost averaging into the biotech sector.
I'm fine with getting assigned, selling call against, but mainly just selling premium in some relatively high IV sector exchange-traded funds (XBI's at 30.9%) while I wait for some of my broad market to come in.
XBI BUYThe XBI Exchange Traded Fund (ETF) is provided by SPDR. It is built to track an index: S&P Biotechnology Select Industry Index. The XBI ETF provides physical exposure, so by buying it you actually own parts of all the 140 underlying holdings.

XBI WeeklyPositive reason for XBI - relatively equal weighted @ 1% - can not know which bio is going to be a winner!
Like the 30 week moving average as an indicator.
Thesis is as rates fall Bios will be more attractive!
Supply of new drugs in big pharma is dwindling/ coming off patent and they need to replace with new drugs for revenue; so Big Parma will be looking to acquire some of the potential winners - AKA MDGL

Bearish Cypher Potential $84.50Looking at AMEX:XBI the biotech sector etf is showing some weakness. It needs to close above $85.95 to continue the uptrend, and not close below $85.60-85.58. If it does, the bearish cypher set up is showing a return to $84.50 w/ a bearish close..
Currently short AMEX:LABU
NOT TRADING OR FINANCIAL ADVICE , PLEASE DO YOUR OWN DUE DILLIGENCE


$xbi - Get me some biotech share bruhIt's almost time to go balls deep into bio tech... its going to be a big 2 years ahead of this one...
