$XBI with a nice looking base I've been wanting AMEX:XBI to drift downwards a bit and turn for a better low risk entry (add on). I think down to $86-$85.50 is potential area that could bring back buyers. This base looks nice.
XBI trade ideas

bearish bat on xbi min target if close below 84 is 82.57 w/ max target of 78. we're currently near the .382 fib level 83.56 (xbi still has more room to fall).. This move is to test the previous resistances as support. same move spy made.. look at how the . 382 was previously resistances and we cleared that level. now it wants to test the support. this trade pair w/ AMEX:LABU AMEX:LABD

$XBI ETF Biotechnology Bull FlagOn 4/11/23 our Algo alert software had a buy signal, today there is a really nice bull flag forming on the AMEX:XBI ETF Biotechnology sector

$XBI - Overhead resistance at $90-96AMEX:XBI #XBI Creeping up. Overhead resistance at $90 - $96. Downside risk $80-$77. 👀


$XBI target zone if, IF, risk-off returnsOn the weekly chart, price seemed to be breaking down from a channel and then reversed course to move higher. If this is a rubberband reaction and risk-off resumes, then this monthly frame shows a 2nd leg down that could move to 62-58.
Alternatively, if risk-on stays the course to continue January's rise, then price moves up to the 20ma, 96-100 area. Watch daily chart to see if price stays over 87-88.


$XBI$XBI – Weekly vs. Monthly
Weekly (left) – new swing high after weeks of consolidation. Momentum indicators started to move higher, RSI is above 50-level; MACD is heading towards a cross above the zero line
Monthly (right) – momentum indicators stopped falling; RSI is moving higher. After falling from mid 2021, MACD appears to have completed its correction and is about to cross.
Could provide opportunities this year!

XBI Short Strangle 60 DTE NeutralBeen in a channel for quite some time now. Seems to be breaking out to the upside. Markets still choppy, so not a true direction set, especially with the earnings season coming.
IVR is actually a bit too low, but premium is still good for a .18 delta ($2.57) on a +/- $480,- margin.
Sell XBI 17mar2023 Call 100 - delta .1884
Sell XBI 17mar2023 Put 78 - delta .1877
Buy To Close @50% ($1.28)

XBI - Starting the year strong with a minor breakoutBiotech stocks have been my focus as many are showing significant relative strength and posting new 52 week highs. I got long XBI yesterday on the break of $85.
Something to consider - stocks well below their all-time highs have a lot of supply to contend with, so the probability of a smooth trend out of a base tends to be lower and raises the probability of failure. The larger degree consolidation could look like this if the selling isn't absorbed by enough buyers at resistance:

Biotechs broke out from 4 month range$XBI out from 4 month range. Individual biotech stocks have been breaking out in past few weeks, and its good to see the sector moving too. Could see a move to $95.

Big move on $XBILast couple days been good for Biotech. Big move on $XBI today.
OBV put in SIX new highs before price the last few days.
Volume often leads price.

biotech at a headprepared for different scenarios but overall continuing bear for biotech. this sector is going to get hit hard from annual plans for labs, and whether we hit top of envelope first or revisit bottom sooner were still in an overall end of bullish corrective phase from bear market leaving lows open for test.


shorting $xbi biotech/ shorting the handle to the c/hlooking for a retrace of the .618 fib level which should give way to the cup/handle breakout pattern of $xbi also notice price action at the top of the wedge


XBI: Monthly OutlookWas going to post this idea sooner, but didn't and now regret it because its essentially almost happened fully.
But better late than never so here we are.
XBI is a short.
It did a head and shoulders with a bear flag/wedge. It broke down from the wedge today and is on its way to its monthly low targets.
Based on a prob assessment, high probability of hitting the first low target at 77.28 and an equally high chance of seeing the second monthly low target of 73.10 this month.
73.10 is kind of where the probability caps this at. From there I would assume there would be consolidation and maybe a slight bounce and not necessarily seeing the 68 TP.
That's it!
Thought I would get a head start on posting some weekend ideas.
If you have any requests, feel free to leave them in the comments. I like to try and experiment with different stocks.
Take care and trade everyone!

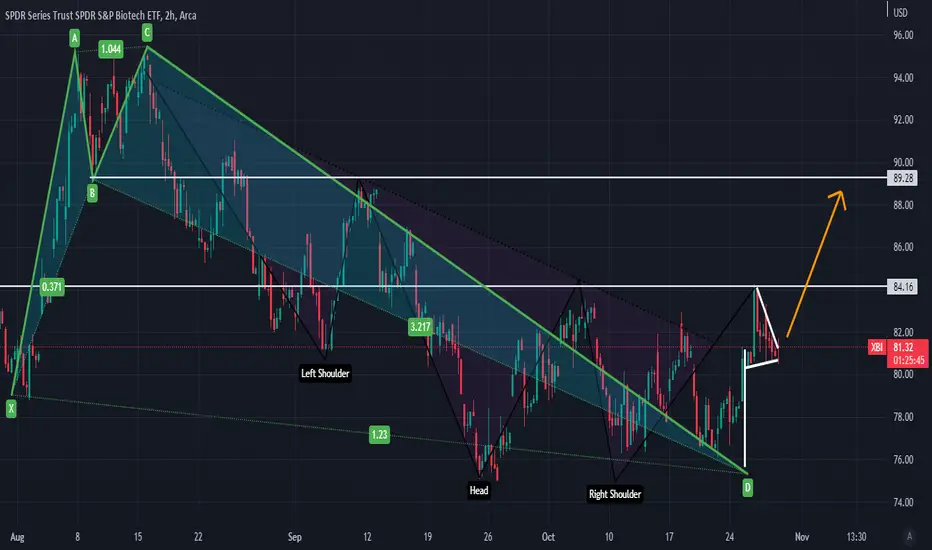
$XBI - Potential Inverse H&S + Potential Channel breakoutXBI has been in down trend channel and now it looks like it might try to breakout again. It also look like it is forming the right shoulder of the inverse H&S.
If the price can stay above $80 in coming days, there is a chance that it can break out of the channel and head towards $97 with potential further upside to $119.
Target 1 - $97
Target 2 - $119
Stop - 74
Risk - Price retreat to $74 and below.
——
Disclaimer: Not investment advice.
If you like this post, follow me and subscribe to my posts for more technical analysis charts.

$XBI Potential Bearish Quarterly Move$XBI, which is a biotech ETF, is showing a potential bearish 2-1-2 continuation on the quarterly chart.
Because of this, I will be looking at biotech stocks for a short.

$XBI possible inverted head and shoulders bottom$XBI biotech ETF developing
a possible inverted
head and shoulders bottom formation
neckline breakout 93.50

9/28/22 XBISPDR S&P Biotech ETF ( AMEX:XBI )
Sector: Miscellaneous (Investment Trusts/Mutual Funds)
Market Capitalization: $ --
Current Price: $81.20
Breakout price: $84.40
Buy Zone (Top/Bottom Range): $80.50-$74.75
Price Target: $99.10-$100.80
Estimated Duration to Target: 75-81d
Contract of Interest: $XBI 12/16/22 85c
Trade price as of publish date: $5.40/contract
