XLE CHARTAnalysis of XLE if you wanna make cheese. Yall making me type this long description for what bro?
XLE trade ideas

Bear Market - EvidenceThis descending triangle in the most "bullish" of sectors - energy - seems to prove that we are in a bear market. The descending triangle seems to trade with a bearish elliot wave pattern for descending triangles as evidenced here:
thepatternsite.com
Share your thoughts in the comments below.

XLE: Commodities short if retestXLE: Commodities short if retest
As usual everything's on the chart. TP is the minimum target.

XLE History Tends to Repeat With rates quickly increasing, inflation running rampant, the fed moving to QT and away from QE. The future certainly looks bleak. A recession will lead to lower gas prices and will eventually bring other prices lower, but first, a massive repricing needs to take place.

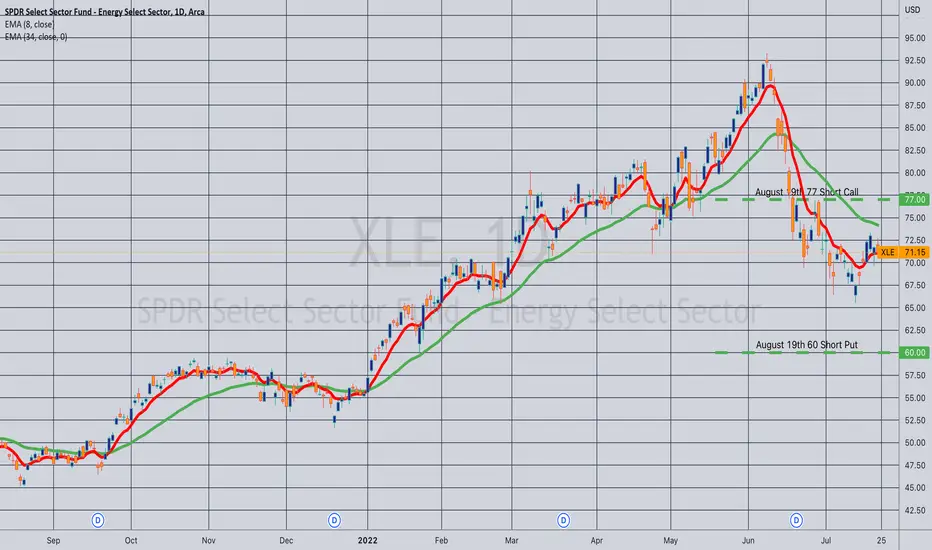
Closed (Margin): XLE August 19th 60/77 Short Strangle... for a 1.39 credit.
Comments: Collected a total of 2.49 in credit with this puppy with minimal fuss/muss. (See Posts Below). Closed today with 28 days to go for a 1.10 ($110) profit, which was basically 50% max of the original setup.
Energy stocks & commodities basing for coming reversal?Using XLE to represent the sector, it appears to be forming a "W" pattern, which could morph into an IH&S reversal pattern, but it still needs a little more time. Green zone is general support, and probable good intermediate term buying opportunity, maybe lasting into the end of the year. Pink boxes are gaps I would expect to be filled before reversal manifests.

Rolling: XLE August 19th 83 Short Call to 77... for a .43 credit.
Comments: Delta balancing my short strangle to delta/theta <1.0. Total credits collected of 2.49 with a resulting delta/theta of 5.84/6.79.

Opening: XLE August 19th 60/83 Short Strangle... for a 2.06 credit.
Comments: High IVR/IV at 76/49. Selling around the 16 delta on both sides. Delta/theta .4/5.73.

XLE: 2YR Daily Macro Data & Popular Indicators For ML AnalysisThis chart was created to accompany a blog post which explores leveraging machine learning (RNN: LSTM) using Tensorflow Keras and SHAP to determine which factors (indicators and correlations with Macro, such as oil futures prices, Fed Funds rate, consumer spending, etc) are found by the model to be the most predictive in nature.
Findings will be posted in the comments.

XLE at 100ema and key level on VPVR$77.50 has a lot of volume and can act as a resistance perfectly in line with the 100ema. Daily candle close above this and it should move into the $80 price range and could sit there for a bit. We would see one more push to the top before oil calms and this forms a lower high around $90 or a double top.
Entered on the drop at $70
TP target 1 now at $77
TP target 2 at $81
TP target 3 at $90

#XLE - time to buy energy names again?200ema has provided solid support for energy names since November 2020. Will history repeat or is this time different?

XLE Playing For A Wave 5 Upside ExtensionIn this update we review the recent price action in XLE and identify the next high probability trade location and price objectives to target

$XLE - end of year target $55Energy prices will fall for all the wrong reasons. US economy will slow; we will see recession soon. As output slows and quantitative tightening increases; prices will fall. Should fall to support levels around $55 by end of the year.
Trigger: 11 day smma crossing the 50 day smma.
$XLE components include $XOM, $CVX, $COP, $MPC

$XLE starts to look cheap around $70.50$XLE broke below weekly support, which happens to be 0.768 Fibonacci support level as well.
I'd want to get long at $70.50 as it'll be the 0.618 level of Fibonacci support and also other important technical factors coincide in that zone. Including volume profile value area high at the same level.

Where I would buy more puts on XLEHello friends. We posted earlier about why the energy sector was probably the Greatest Short Of All time. Did anyone join us for shorting? We made a *lot* of money. But now it might be time for a brief bullback, before going much lower. Let's see if we can reload some more puts after that happens.
Thanks for playing, and to the guy who kept taking a crap all over me for me idea, maybe save your money next time and listen to the autistic trading savant rather than yourself. GG.

Energy Sector Trend DownAll major companies across the globe related to energy sector might have made a top... oil bounced down hard as well. Some relief on inlfation or just moment situation... for now its down trend!

XLE breaks TL but holds vol profile zone(75-77); is 71 or 65 nxtUpdate on my last post that XLE energy sector must hold the red trendline at 79.
BEARISH CASE shortterm: On Thursday it broke not only the TL but also broke below my yellow consolidation box.(middle one). As of now it is holding the volume profile zone at 75 to 77 area. Looking at the heavy selling volume in all sectors, a double bottom at 71 is very probable. 76.70 is the 0.618 Fib level while 71 is the 0.786 Fib.
Worse, we may even see a retest of the blue wedge at the 65 pivot line. That will be a 100% retracement back to the Feb 24 invasion low. (It broke out of the blue wedge & retested it last Jan 2022 & proceeded to make a measured 10 points move to 82 & then another 10 points move to 92)
Still BULLISH longterm:
If XLE bottoms out at the current volume profile zone & reclaims the red trendline in the next few days, we may see a retest of 92 or maybe even push another 10 points higher to 102. You may ask if that is still possible with a slowing economy? Bear markets on average starts 5 months before actual recession (2 consecutive Quarters of negative GDP). We are now at the 5th month but employment & production & consumption numbers still suggest recession is still far out maybe in 2H2023. Either we are in uncharted territory with a prolonged bear market or maybe we will see another melt-up rally first before recession kicks in. This will be possible if inflation & rates slow down with the FED pivoting to less hawkish stance in September after the already priced-in June & July 75 basis point rate hikes.
Note: A slowly rising dollar will not be good for commodities like oil, food, industrial metals & gold but it will help cushion the bad effects of inflation on buying power…good for imports but bad for exports.
Not trading advice. Pls like & follow if this helps!

Is $XLE making a bearish ascending wedge?It seems like the Energy sector ETF $XLE is making an ascending bearish wedge.
It's showing lots of resistance around the $82.9 area and hasn't be able to close above it for the past ~2weeks.
I wouldn't be surprised if it has a fake breakout to the upside before eventually falling back inside the wedge.
Keep an eye out for a break to the down side as the measured objective would be around the $64.7 area.
I'm neutral for the time being but keeping a close eye on this for a bearish reversal.

$XLE ~ Appears correction is occurring...As shown, finally it appears energy companies are cooling off. Expectation is XLE continues to rollover and will create a exceptional opportunity within the next 12-24 months. Will track closely and when the opportunity presents itself, we will be ready.

XLEThe Energy Select Sector SPDR (XLE) is a non-diversified ETF. It tracks the largest oil and gas, consumer fuels and power equipment companies in the S&P 500. The ETF has a dividend yield of 2.5%, and is up 59.8% year-to-date.
The fund is down 5.2% on Monday and is set to see a further decline, however the long-term trend for energy is strongly positive.
Take advantage of short-term weakness at the appropriate opportunity. It is only a matter of time before stocks resume their journey to new highs. Buy the XLE at $80.50 lmt gtc

Rising Wedge in Energy ETFEnergy stocks have been ripping all year , but now there’s a potential reversal pattern in the key sector ETF.
The SPDR Energy Fund has made higher lows and higher highs since mid-May, but the lows have ascended more quickly than the highs. The result has been a rising wedge. That’s a potential bearish reversal pattern with highs failing to confirm the enthusiasm of the lows.
Next, the Parabolic SAR indicator just flipped from a bullish reading to a bearish reading.
Third is the Moving Average Distance indicator at the bottom of the chart. This Custom Script shows price’s distance from a moving average -- in this case the 50-day simple (SMA). Notice how it recently neared the top of its range. While this isn’t a definitive signal in isolation, it shows how Energy is out of step with the broader market. (The S&P 500 is 7 percent under its 50-day SMA while Energy is 9 percent above .) This may create the potential for some catchup to the downside.
Finally, you have the level around $89.22 where XLE peaked in November 2014 before beginning a six-year slide. The fund’s failed breakout through this area could also suggest longer-term resistance remains in effect -- at least for the time being.
TradeStation has, for decades, advanced the trading industry, providing access to stocks, options, futures and cryptocurrencies. See our Overview for more.
Important Information
TradeStation Securities, Inc., TradeStation Crypto, Inc., and TradeStation Technologies, Inc. are each wholly owned subsidiaries of TradeStation Group, Inc., all operating, and providing products and services, under the TradeStation brand and trademark. You Can Trade, Inc. is also a wholly owned subsidiary of TradeStation Group, Inc., operating under its own brand and trademarks. TradeStation Crypto, Inc. offers to self-directed investors and traders cryptocurrency brokerage services. It is neither licensed with the SEC or the CFTC nor is it a Member of NFA. When applying for, or purchasing, accounts, subscriptions, products, and services, it is important that you know which company you will be dealing with. Please click here for further important information explaining what this means.
This content is for informational and educational purposes only. This is not a recommendation regarding any investment or investment strategy. Any opinions expressed herein are those of the author and do not represent the views or opinions of TradeStation or any of its affiliates.
Investing involves risks. Past performance, whether actual or indicated by historical tests of strategies, is no guarantee of future performance or success. There is a possibility that you may sustain a loss equal to or greater than your entire investment regardless of which asset class you trade (equities, options, futures, or digital assets); therefore, you should not invest or risk money that you cannot afford to lose. Before trading any asset class, first read the relevant risk disclosure statements on the Important Documents page, found here: www.tradestation.com .

6/12/22 XLESPDR Select Sector Fund - Energy Select Sector ( AMEX:XLE )
Sector: Miscellaneous (Investment Trusts/Mutual Funds)
Market Capitalization: $--
Current Price: $88.71
Breakout price: $90.50
Buy Zone (Top/Bottom Range): $84.30-$74.05
Price Target: $112.00-$114.20
Estimated Duration to Target: 133-140d
Contract of Interest: $XLE 9/16/22 90c
Trade price as of publish date: $5.90/contract

Energy sector continues to trend against S&P500Energy is going strong, long term trend is set with $XLE outperforming the benchmark index despite market volatility and rates breaking out higher last week.
$XLE/$SPY made a classic Wycoff pattern then shot up higher this year. If history is a guide, this trend is the beginning of at least a decade long uptrend.
