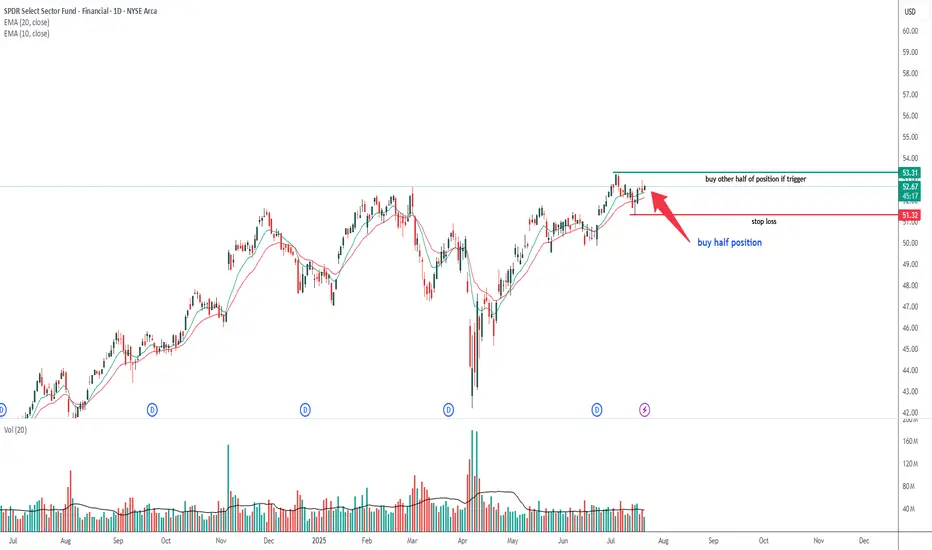
XLF -- Possible trade opportunityXLF -- Possible trade opportunity based of price, volume and chart pattern
Key stats
About SPDR Select Sector Fund - Financial
Home page
Inception date
Dec 16, 1998
Structure
Open-Ended Fund
Replication method
Physical
Dividend treatment
Distributes
Distribution tax treatment
Qualified dividends
Income tax type
Capital Gains
Max ST capital gains rate
39.60%
Max LT capital gains rate
20.00%
Primary advisor
SSgA Funds Management, Inc.
Distributor
ALPS Distributors, Inc.
XLF offers efficient exposure to the heavyweights in the US financials segment. Its cap-weighted, S&P 500-only portfolio means that its concentrated in large banks and avoids small-caps. For many investors and traders, XLF has been the go-to ETF for financials exposure, although there are more comprehensive funds out there for long-term exposure. Note: XLF spun off its real estate exposure in September 2016, consistent with the GICS reclassification that elevated real estate to sector-level status. The change was material: Real estate comprised about 20% of the fund at the time. For each share held, XLF shareholders as of 9/16/16 received 0.139146 shares of XLRE, State Street Global Advisors' real estate ETF. (Immediately prior to the distribution, XLF had swapped its REITs for shares of XLRE.)
Related funds
Classification
What's in the fund
Exposure type
Finance
Stock breakdown by region
Top 10 holdings
Weekly review of SPY, QQQ, GC, CL, ETH, BTC, UBER, TOAST, TKOWeekly review of SPY, QQQ, GC, CL, ETH, BTC, UBER, TOAST, TKO

Pre-Earnings Breakout in Financials?Financials could be attempting a breakout, two weeks before the sector kicks off earnings season.
The first pattern on today’s chart of the SPDR Select Sector Financial ETF is the price level around $52. XLF stalled at that zone in February after peaking about 1 percent below it in November. Februa

The Big Banks are in BIG TROUBLEAs you can see on this weekly chart, the XLF has been in this steady up trend since October 2023. It bounced off this upward slopping trendline 3 different times and then finally broke through it on the 4th hit, then came back up to test the underside of the trendline as resistance. It did get back

Weekly review of SPY, QQQ, GC, CL, ETH, BTC, UBER, TOAST, TKO, Weekly review of SPY, QQQ, GC, CL, ETH, BTC, UBER, TOAST, TKO, XLE -- June 6/30/25

Rhythm of the Great BearUndead Bear Captain's Log
April 27, 2025
Will make one final attempt to chart and navigate the murky waters of the Great Bear.
XLF may be a good candidate with still distinct waves, like XRT, XLRE and XHB.
All other sectors, especially SPY are skewed by tech, same-day options and basically uncharta

Banking Sector Recovery : XLF IndexI think the markets love Joe Biden. After he won the elections the market just made nice recoveries. On this XLF index I am looking at $32.00 price target before the end of 2020.

XLF watch $48.45/68: Key Resistance holding up the Recovery WaveXLF trying to recover along with the general market.
Currently resting a proven resistance at $48.45-48.68
Bears look to be winning, so look at supports below.

XLF Trade LevelsThe financial sector interests me, especially with an upcoming interest rate meeting, earnings report, and declining consumer sentiment.
Ultimately, I like to swing the Sector ETF's but they also make for affordable day trades!
With XLF being in a tight range on the Weekly+ timeframes, it makes i

XLF Banking crash comingThis is something I have worried for sometime and my main reason for being very bearish. Tariff has only help uncover the banking mess hiding underneath. XLF could crash 5-6% in couple of sessions based on VP
www.theguardian.com

See all ideas
Summarizing what the indicators are suggesting.
Oscillators
Neutral
SellBuy
Strong sellStrong buy
Strong sellSellNeutralBuyStrong buy
Oscillators
Neutral
SellBuy
Strong sellStrong buy
Strong sellSellNeutralBuyStrong buy
Summary
Neutral
SellBuy
Strong sellStrong buy
Strong sellSellNeutralBuyStrong buy
Summary
Neutral
SellBuy
Strong sellStrong buy
Strong sellSellNeutralBuyStrong buy
Summary
Neutral
SellBuy
Strong sellStrong buy
Strong sellSellNeutralBuyStrong buy
Moving Averages
Neutral
SellBuy
Strong sellStrong buy
Strong sellSellNeutralBuyStrong buy
Moving Averages
Neutral
SellBuy
Strong sellStrong buy
Strong sellSellNeutralBuyStrong buy
Displays a symbol's price movements over previous years to identify recurring trends.
Frequently Asked Questions
An exchange-traded fund (ETF) is a collection of assets (stocks, bonds, commodities, etc.) that track an underlying index and can be bought on an exchange like individual stocks.
XLF trades at 53.44 USD today, its price has risen 0.70% in the past 24 hours. Track more dynamics on XLF price chart.
XLF net asset value is 53.42 today — it's risen 3.23% over the past month. NAV represents the total value of the fund's assets less liabilities and serves as a gauge of the fund's performance.
XLF assets under management is 52.56 B USD. AUM is an important metric as it reflects the fund's size and can serve as a gauge of how successful the fund is in attracting investors, which, in its turn, can influence decision-making.
XLF price has risen by 3.59% over the last month, and its yearly performance shows a 25.27% increase. See more dynamics on XLF price chart.
NAV returns, another gauge of an ETF dynamics, have risen by 3.23% over the last month, showed a 11.56% increase in three-month performance and has increased by 27.13% in a year.
NAV returns, another gauge of an ETF dynamics, have risen by 3.23% over the last month, showed a 11.56% increase in three-month performance and has increased by 27.13% in a year.
XLF fund flows account for 1.31 B USD (1 year). Many traders use this metric to get insight into investors' sentiment and evaluate whether it's time to buy or sell the fund.
Since ETFs work like an individual stock, they can be bought and sold on exchanges (e.g. NASDAQ, NYSE, EURONEXT). As it happens with stocks, you need to select a brokerage to access trading. Explore our list of available brokers to find the one to help execute your strategies. Don't forget to do your research before getting to trading. Explore ETFs metrics in our ETF screener to find a reliable opportunity.
XLF invests in stocks. See more details in our Analysis section.
XLF expense ratio is 0.09%. It's an important metric for helping traders understand the fund's operating costs relative to assets and how expensive it would be to hold the fund.
No, XLF isn't leveraged, meaning it doesn't use borrowings or financial derivatives to magnify the performance of the underlying assets or index it follows.
In some ways, ETFs are safe investments, but in a broader sense, they're not safer than any other asset, so it's crucial to analyze a fund before investing. But if your research gives a vague answer, you can always refer to technical analysis.
Today, XLF technical analysis shows the strong buy rating and its 1-week rating is buy. Since market conditions are prone to changes, it's worth looking a bit further into the future — according to the 1-month rating XLF shows the strong buy signal. See more of XLF technicals for a more comprehensive analysis.
Today, XLF technical analysis shows the strong buy rating and its 1-week rating is buy. Since market conditions are prone to changes, it's worth looking a bit further into the future — according to the 1-month rating XLF shows the strong buy signal. See more of XLF technicals for a more comprehensive analysis.
Yes, XLF pays dividends to its holders with the dividend yield of 1.36%.
XLF trades at a premium (0.03%).
Premium/discount to NAV expresses the difference between the ETF’s price and its NAV value. A positive percentage indicates a premium, meaning the ETF trades at a higher price than the calculated NAV. Conversely, a negative percentage indicates a discount, suggesting the ETF trades at a lower price than NAV.
Premium/discount to NAV expresses the difference between the ETF’s price and its NAV value. A positive percentage indicates a premium, meaning the ETF trades at a higher price than the calculated NAV. Conversely, a negative percentage indicates a discount, suggesting the ETF trades at a lower price than NAV.
XLF shares are issued by State Street Corp.
XLF follows the S&P Financial Select Sector. ETFs usually track some benchmark seeking to replicate its performance and guide asset selection and objectives.
The fund started trading on Dec 16, 1998.
The fund's management style is passive, meaning it's aiming to replicate the performance of the underlying index by holding assets in the same proportions as the index. The goal is to match the index's returns.