Long idea on XLFNice ascending triangle setup here, with bullish divergence. Stock is near ATH levels. LT trend is up. Always manage your risk
XLF trade ideas

XLF STAYING SHORT @ 39.31Daily stoch rolled over. More selling buying
Weekly starting roll over again. Most important thing is TNX rally and XLF not breaking out that means bull run over. Bank earnings most likely already baked in as with all earnings imho. TNX keeps rising banks don't wow get ready we can wake up 1 morning 1000 points down keep going .

Will the banks move higher? XLF struggling at the top of the range . I notice the banks pulled back when XLF got rejected.. Banks have earnings next week so let's see if this makes new 52week highs


Update XLF Short @ 39.00Daily heading down. Lower highs. Vol more selling buying. Can see it go 35 200 day. Just hanging on to the 50 day MA.
Weekly going sideways wants turn lower it will.
Know lets talk about banks these banks are going to Default
covid money stopping
unemployment stopping
Hong Kong deep shit
and last we have TNX 1.47 Banks should be breaking out higher TNX goes and banks don't higher inflation guys we are close to the crash. So when we have a rally don't say bulls in charge they aren't and when we stop that bottom will be temporarily.

Financial ETF Is Squeezing HigherThe SPDR Financial ETF broke out to record highs in February, stalled in June and has been resting since. Now it may be getting ready for another move.
The first pattern on this chart is the 50-day simple moving average (SMA). After dancing around this line for almost four months, XLF has managed to hold above it since the end of September. That’s especially noteworthy because, aside from SPDR Energy , every other major sector ETF is under its respective 50-day SMA. (Along with the entire S&P 500.)
Next, the last bounce represented a higher low than the September 20 trough. That also contrasts with the broader SPX, which made a lower low.
Switching to the weekly chart, notice that XLF rebounded so quickly from the first drop that it formed a bullish outside week:
The macro backdrop may also support financials because the yield curve is steepening as rates increase. Several big names, including JPMorgan Chase , Bank of America and Goldman Sachs report next week. XLF may need a little more time given weakness in the broader market. But as long prices hold the 50-day SMA, traders may look for the trend to continue.
TradeStation is a pioneer in the trading industry, providing access to stocks, options, futures and cryptocurrencies. See our Overview for more.

$XLF: Long financials now...We have a tremendous signal to go long financial names now, as the yield curve is set to steepen once again and yields are rising on the back of the last FOMC meeting outcome, and the reopening momentum generated by the evolution of the Delta variant, and news of an antiviral pill from Merck that can cause a 50% reduction of fatalities and hospitalizations that recently surfaced. Charts are very constructive, as the $USB one I pointed out. I'm currently long a variety of value/financials/energy names as well as crude oil futures options for a while now, since AAII readings sunk below 25% recently. Now the broad market chart looks like a bottom is forming, and today a buy signal popped in $XLF, so the time is now!
Cheers,
Ivan Labrie.

XLF SHORT @ 38.00Daily heading up so it can rally some look at selling vol. Still above 50 day MA
Look weekly heading down broke 68% that weekly says any rally up will fail stay short. Trust weekly trend down.

Potential Opportunity - Patience PaysPreviously I wrote a brief note explaining caution for the US Banking industry as illustrated by XLF.
This is due to:
- market risk of a broader market pullback - as currently being experienced
- impact from Covid-19 variants like Delta etc.,
- the cumulation of record high bank reserves (cash) which serve to stress Bank Capital and Capital adequacy ratios. These reserves have been building up due to the FED's policy of buying Bonds in the market. Once sold, the vendor banks cash at a Bank which severs to increase the Bank's liabilities. The FED has tried to mitigate this effect by using reverse repos - which is ridiculous - it should stop the buying / QE ie the naughty word - Taper!!! :)
The opportunity to be long includes:
- market risk subsides as debt ceiling is mitigated.
- infrastructure bill goes through which is GDP positive.
- further recovering of the US and European economies noting n increased travel facilitated by increased vaccination rates.
- Bank capital being strong as it is, has seen some Banks start to sell assets which have a lower capital rating (for the purposes of capital measurement) and will eventually open the door to strong lending programmes noting the prior comment.
- still good fiscal support - so economy, GDP and the broader market is growing.
In other words a decent credit cycle may ensue which will be very positive for Banks and of course XLF.
However - Patience Pays!!!
Buying in smalls around key support areas and build a position - no 'binary' trading.

$XLF Financials Finds some support at last.
Hopefully you find the chart helpful in terms of Supports & Resistance etc.
we refrain from adding commentary on the chart as that is reserved for our members and we are very conscious of not giving financial or trading advice.
Thank you for taking time to consult our chart and we would really appreciate a like, follow or comment.

XLF more downside to come?The volume has made a notable shift recently, though it doesn't suggest much more beyond heading toward the lower end of the range it's been in for the last 4+ months.

XLF Daily TimeframeSNIPER STRATEGY (new version)
It works ALMOST ON ANY CHART.
It produces Weak, Medium and Strong signals based on consisting elements.
NOT ALL TARGETS CAN BE ACHIEVED, let's make that clear.
TARGETS OR ENTRY PRICES ARE STRONG SUPPORT AND RESISTANCE LEVELS.
ENTRY PRICE BLACK COLOR
TARGETS GREEN COLOR
STOP LOSS RED COLOR
DO NOT USE THIS STROTEGY FOR LEVERAGED TRADING.
It will not give you the whole wave like any other strategy out there but it will give you a huge part of the wave.
The BEST TIMEFRAMES for this strategy are Daily, Weekly and Monthly however it can work on any timeframe.
Consider those points and you will have a huge advantage in the market.
There is a lot more about this strategy.
It can predict possible target and also give you almost exact buy or sell time on the spot.
I am developing it even more so stay tuned and start to follow me for more signals and forecasts.
START BELIEVING AND GOOD LUCK
HADIMOZAYAN

XLF: Caution is requiredCommon sense really - risk factors are:
- Infrastructure deal delayed or significantly watered-down
- Volatility from the debt ceiling negotiations
- Broader market sell-off as per above points
- Covid variants (but may be positive for tech stocks but buy on pull backs)
Unless XLF is going to provide some good value, and that is only after a pull brake in the broader market, I can't see any reason to be long. In fact, I would wait and buy at a max level as indicated.

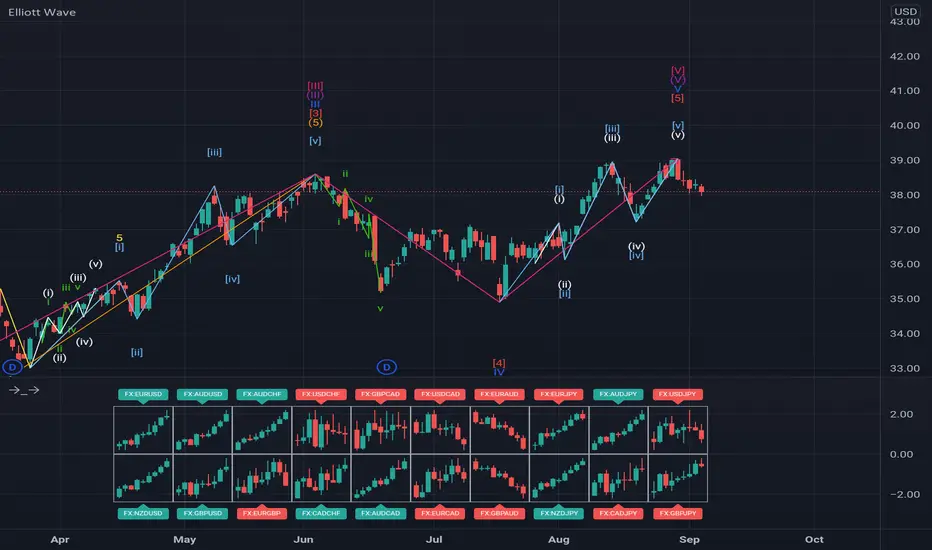
Stocks - XLF Elliot Wave ForecastIdea for XLF:
- For summer-EOY, will likely need to look at Finance sector as one of the leaders in indices.
Technicals:
- Price losing momentum (falling into lower channels), bounces appear corrective in nature.
- Distribution pattern formed.
- Ending diagonal broke down.
- Price very likely to sell-off to bottom of the megaphone pattern, 9M SMA, 20W SMA, 200D SMA.
- Usually the distributive sell-offs in indices form the W shaped harmonic structures, so a secondary sell-off is very likely.
- Then a corrective rally into mid July, before selling off in earnest into Q4.
Fundamentals:
- June 30, G-SIB banks begin stock buybacks, should save XLF.
- However, this is extremely bearish after an initial relief rally, see:
It remains to be seen if the buyback rally will fuel another bullish cycle, leading into earnings season, or will indeed be corrective in nature, so watching out for the nature of the bounce, should it come.
GLHF
- DPT


XLF daily Elliott wave countOn daily chart of XLF we have multiple wave 5 of different degree very bullish, but now we have a complete 5 wave in small degree so we can expecting price calm down a little bit, so after that if it break previous high it is a good opportunity to buy short-term and midterm
XLF STAYING SHORT @ 37.42Daily chart says stay long just a pull back
in a uptrend. I would pay attention to XLF may start to drop all up TNX
Weekly fine over bought still way above 70% and a great up trend
IMHO banks may start weakening XLF daily has lower highs will watch

XLF - Dead CatfishNew banking regulations in EU and elsewhere combined with QE punch bowl drying up is taking wind out of the sails of the Financials.
XLF appears to be struggling at the mid-line of the regression channel again!
Potential 4th failed attempt to cross midline unfolding.
Similar chart pattern last July into Sept, which resulted in a ~10% sell off.
Bearish Engulfing candlestick pattern at recent top.
Several nearer and longer term price gaps to fill to the downside:
Nearer-term gaps
@ $37.75
@ $37.20 and near 50-day MA
@ $36.01 small but there
Several more gaps a bit farther south.
Most indicators rolling over/sick on the daily. XLF near ATHs but the ADX looking like a dead catfish that cant swim anymore...just floating with the current...and the current is taking it down off the regression channel mid-line sooner than most expect.
Target = gap fill near 50-day MA and then a kiss off the 200-day if we get some action to the downside.
Short Oct 15th Puts with $35 dollar strike.
Not financial advice.

FinancialsSector entering overbought territory with major resistance ahead, ATH short-term breakout likely with a pullback

long banksbecause TNX + money. Jackson hole gonna burn a hole in your purchasing power. INFLATION & HAWKS back on the menu

XLFDouble topping at resistance so far. Hasn't tested the 200 since last November. Wouldn't be surprised if it tests it before this November. Bearish below ath.

Short XLFThe end of QE is obviously bad news for financials.
Bought some XLF puts for this week and next. This is the one sector that I don;t expect to bounce back tomorrow

