Major pullback expected in financialsI see an easy 10%-15% downside risk opening up in XLF. I have taken a short position via 34 strike price puts for may 21 expiry. My target is 31 to close position and will consider going long @ 29 level.
XLF trade ideas

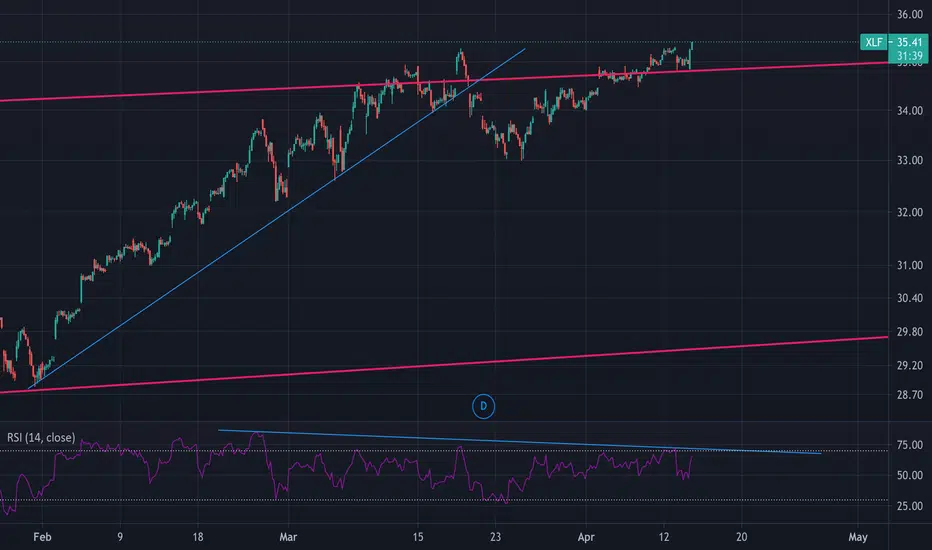
$XLF Bank's Earnings week.Looking at the near term indicators, the Stoch RSI stands out the most for me. On a daily timeframe, the daily RSI is not overbought, but the weekly timeframe shows some overbought action. My only worry this week would be if banks don't do well, which might be pretty difficult, that XLF might find itself double topping at these levels and starting a corrective wave. I'm looking at a breakout over 35.28 and holding to confirm a fifth wave above these levels. I've indentified key support and resistance levels at the pink horizontal lines pointed on the chart.

Continuing hourly negative divergenceShowing continued bearish divergence on financials with stochastic momentum getting weaker. Stochastic hasn’t seen the bottom of the range since start of month.

Long | XLFAMEX:XLF
Possible Scenario: LONG
Evidence: Price Action
This is my idea and could be wrong 100%,
TP ~35
CALLS for 21 April Strike 35$

XLF short reversal set upShort XLF at 30 minute level of supply 35.05 -35.13
Stop loss at 35.24
Target #1 34.38 Target #2 is 33.78
Risk is .19 Reward is .67 for Target #1 and 1.27 for Target #2
Intraday or Short term only as bullish trend is strong!
Abort trade if prices consolidates right below the level or if price gaps above level in premarket.


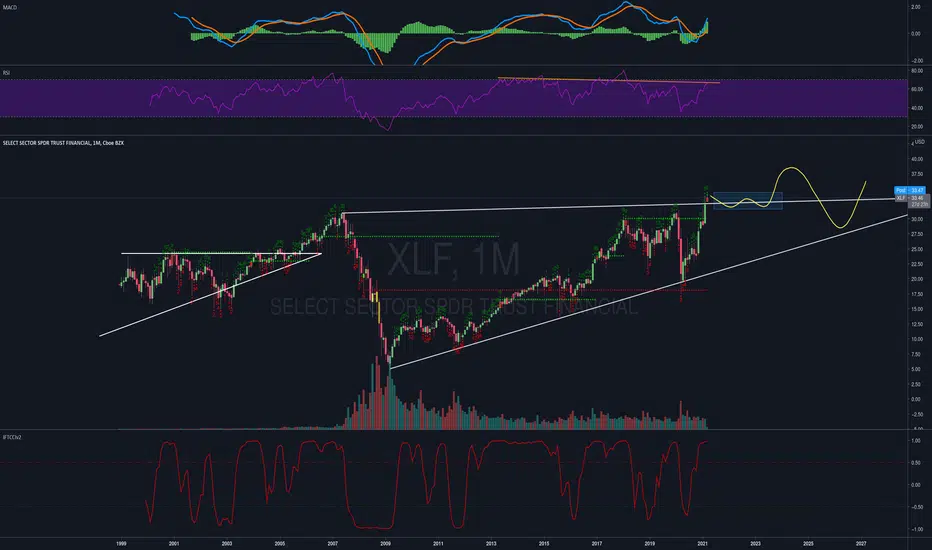
XLF Top?Note the weekly volume reversal in XLF last week (see scandinavianmarkets.com to view this chart). This is interesting in light of the rotation narrative (value/growth). Previous weekly volume reversals occurred in 2001, 2007, and 2010…great time to prepare for a downturn. Also, 5 waves up from the 2009 low are visible in XLF. The channel is perfect and momentum guidelines ‘agree’ with the proposed count.

One month performance $SPX $XLF $XLE $XLK $XLY One month performance
$SPX $XLF $XLE $XLK $XLY
$XLE & $XLF explains most of the $SPX performance of the past month but they are starting to roll over.
Rotation back into tech?

No SLR tread carefully on XLF and Banks in generalTypical recovery play, October/November seems to have been the best time to go long anything. On the shorter term, XLF is bouncing off a bullish trendline, with over all a very decent bullish channel on the longer time frame.
However, this looks awfully similar to my ARKF play, where it had a similar set up, but cratered into the Earth's core. Jpow and friends have stopped SLR for now, which is bullish on the economy as it indicates less relief is needed, but I think it can be very bearish for the stock market. Since banks don't have all the free cash, capital requirements may now make the banks liquidate some assets.
I want leaps on XLF, as value play benefits seem to outweight high growth tech stocks right now with the looming fears in inflation and the Fed raising interest rates. Realistically, nothing is safe right now and I'd be very careful with long positioning.
Bullish reasonings, stimmy, a fat injection of cash. Things are reopening, vaccine outlook is great. Even some banks are buying Crypto too. My ARKF ideas may or may not have been tagged NSFW.

$XLF holding some puts here...$33 3/31 puts as a hedge, if fed isn't raising rates, banks should begin to pull back...


XLF in bearish technical postureFinancial sector, XLF, has been outperforming other sectors in S&P as what seems to be a sector rotation is taking place. Money is coming out of technology to more defensive sectors recently. Nevertheless, when I look at this XLF chart, it is screamingly bearish. Bearish rising wedge with negative divergence on both PPO and RSI. It is pretty extended as well. It's right on the trend line. One big red day may just break it or a gap down on the bad news despite what happened during FOMC meeting today.
Have a good trade everyone,
T.

Time to test the 200 Daily SMADivergences in the momo indicators. I am thinking a deep pullback to 200 Daily SMA, the red MA on the chart. Nicely lines up with SPY in the previous idea. Either all of these indexes will honor the divergences or none will. What do you think?

$XLF financials will be my hedge...always need a few, like this for a pull back, if good for the market...

Elliott Wave View: XLF Pullback to Stay SupportedShort term Elliott Wave View suggests that the rally from September 2020 low is unfolding as a 5 waves impulse Elliott Wave structure. The 1 hour chart below shows wave (3) of this impulse ended at 35.2. Wave 4 of (3) ended at 32.16, and the rally in wave 5 of (3) unfolded as an impulse in lesser degree. Up from wave 4, wave ((i)) ended at 33.95, and pullback in wave ((ii)) ended at 32.60. The ETF resumed higher in wave ((iii)) towards 34.58 and wave ((iv)) pullback ended at 33.52. Final leg higher wave ((v)) of 5 ended at 35.20 which also completed wave (3) in higher degree.
Wave (4) pullback is now in progress to correct cycle from January 29 low before the rally resumes. Structure of the pullback is proposed to unfold as a zigzag Elliott Wave structure where wave A ended at 34.25. Expect the ETF to rally in wave B then turn lower in wave C of (4). Afterwards, expect the ETF to resume higher again. As far as pivot at 32.16 low stays intact, expect pullback to find support in the sequence of 3, 7, or 11 swing for more upside. Potential target to the upside is the 100% fibonacci extension of wave (1)-(2) from September 2020 low at 37.54.

XLF beats QQQFinancial sector overpreform Tech since Feb 2021 and reached resistance level of April 2020

XLFLooks more like a continuation pattern and not a reversal. Bought a few weekly calls with today's day trading profits.

Banks need to retraceWith a bear flag i can see banks retracing to fill some gaps. Then a new leg up will emerge

XLF shooting star top of channel $BAC $WFC $CIT $JPM $XLFtop of channel / ABC or WXY complete from march lows after triangle breakout in late oct/early november. shooting star weekly. please post and correct me but zooming out i think its 5-3-5 ABC for W (2009 low to jan 2018) into an X wave and now completed X within WXY of the X macro..startin Y down to finish macro X.
August 20 $23P on $BAC for me but this thing might take longer than I expect considering W (within macro X of WXY from 09 low) went from jan 2018 - march 2020

$xlf looking to go the distance distance $xlf real bullish on the financial sectors currently thinking 38% should start going back to treasury bonds and finances.

XLF: The Best ValueOn the back of a rotation to value and steepening interest rates financials make a fundamentally good play if you want to be long in the stock market.
We are breaking the last prior high with renewed momentum and signs of accumulation throughout the complex.
