XLF ETF: Sell opportunity on 1D. A Golden Cross took place (MA50 crossing over the MA200) on 1D on the XLF. Although this is theoretically a bullish development, its has been bearish on 1D in the last two times that this was spotted. In fact the price lost around -3% from the top candle of the Golden Cross until it touched the MA50 again. This gives us a roughly 1 week window and short opportunity.
** If you like our free content follow our profile (www.tradingview.com) to get more daily ideas. **
Comments and likes are greatly appreciated.
XLF trade ideas

XLF is hotNice break out from XLF recently. After earnings and the S&P hitting ATHs, the this sector is doing great. Also the 50/200 MA "golden cross" is becoming likely. I've got some long dated calls on this one.


XLF = f(Fed decision)?XLF has been lagging.
Technically is in good position to start moving up to next level.
Watching how fed decision may affect this ETF & market. The meeting is this week Tue-Wed.

XLF (Select SPDR Financial) ETF settings up for a breakoutIt is nice to be prepared for what could come. The AMEX:XLF is definitely setting itself up nicely for a bullish move.
Yesterday, we had a moving average cross over and the price is pulling back off an establish resistance zone. A breakout here could make for a great bullish swing trade.
www.youtube.com


XLF is going to take a nosedive as the US turns dovishRight, a bit of a congested chart...
In white, we have $XLF, purple, the US unemployment rate, orange is the European bank index and in yellow, we have the effective Fed Funds rate (US interest rate).
Recent rhetoric from the Fed has been pretty dovish, and we have had a pause in hiking rates, with there likely to be absolutely no hike this year.
If an economy that is apparently 'doing well' cannot afford a rate hike, is there not something seriously wrong?
Let's take the European banks...
Since the crisis, they've experienced negative rates whilst the US has had positive real rates...
See, banks like interest rates.
It allows them to make money, and allows for productive lending since there is not adverse selection when it comes to borrowers.
The Fed is about to follow the ECB's lead... I think Fed member Williams said they could go to negative rates if needed...
Which is crazy, since all they end up doing is creating zombie firms.
So let's get this idea set...
The Fed are pausing with rate hikes...
They're likely to stop the balance sheet run off...
And unemployment is at a record low...
Every time the Fed has stopped their rate hike cycle, unemployment has increased and XLF has fallen off...
Is that a decent enough thesis to get short if we start seeing unemployment data tick up?
Well, we already have... we've just had the highest Q1 layoffs in the US since the financial crisis...
Buckle up!

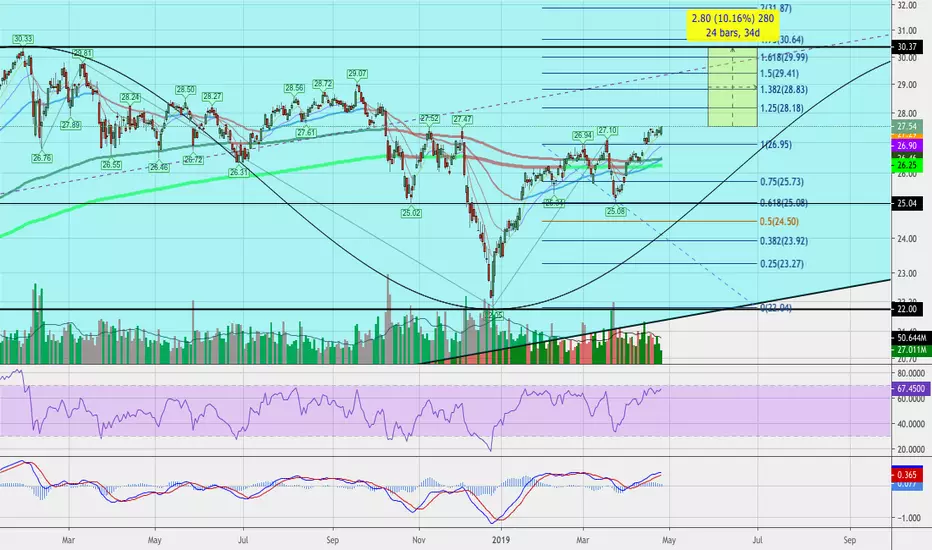
Complex Inverse Head & Shoulders on the XLF. Could rally higher.The XLF is currently forming what appears to be a complex inverse head and shoulders pattern. As it sits right now, price is holding between the 50 and 200 day moving averages (50 day acting as support, 200 day acting as resistance) and we could be setting up for a golden cross (50 MA crossing the 200 MA) into an eventual retest of the neckline of this complex inverse head and shoulders pattern which is around $27.10. The neckline of the inverse head and shoulders pattern can be drawn a few ways. I have the neckline around $27.10, but I can see arguments for $27.50. Regardless, I either want to see a break-out above the neckline with volume, or a break-out into a retest of the neckline as new support before consolidating and eventually moving higher.
Moving average guide (All daily for this post):
50 day moving average in Green.
100 day moving average in Yellow.
200 day moving average in Red.
-This is not financial advice. Always do your own research and own due-diligence before investing and trading, as for investing and trading comes with high amounts of risk. I am not liable for any incurred losses or financial distress.

This is nuts XLF Fed is wrong, and the markets know itSo, if you look at XLF, Never fully recover since the financial crisis, so the big jump in Yields, since 2017 trump presidence is back where all rally started, the weird thing is that correlation bewteen yields, and bank stocks was right in dicember and these 5 month rally, in anticipation of earning is not price in, earning cuts, honestly did you know that banks, make less money when yields are below 3%, so the last year speculators, told that 10 yield could be 4.5% in what universe thats is going to happen? people dont see it yet,im scare how reckless banks and fund managers has been in the last 5 months all because of china trade deal like, tax cut 2018, always a reason to keep these bubble higher than ever, these distorsions of reality is what make vix explotions, is like there is not risk at all, these time are full controversial because there has been low volume, if these low volume extend, we could have liquidity problems, i honestly dont know if we are near or close to a recession, but in fact is when the fed tell that we have a recession is already too late, Germany near recession, japan, near recession, the bigger risk that all world market is that there is a deflation risk, because of these stupid monetary policys, is like a cocaine that markets coudnt live without, i dont Know when markets are going to pull the trigger but im not long term these market at all, in fact that all these gains of 2019 are superficial and artificial, all manipulation the same manipulators are back in, shorting the vix, until the whole thing implode, if you are a long term investor, look at perspective where you are now, where you want to be meanwhile, i will be ready to short the hell of these bubble. Becareful traders. GL

Early innings of risk-on behaviourI believe we are going to get more very bullish days in the near future. XLF/XLU tracing out a pattern similar to early 2018 imho

XLF, Financials at ResistanceFinancial sector is one of the largest components of S&P 500. On Friday it retested its important resistance and ended up as a doji candle. If it starts the pullback to the mean, which is confluence with 20 EMA then it will drag the index down as well. Watch financials to confirm your ideas about SPY trading.
04/06/2019

$XLF Financials are on the move.Yeah we all hate the banks and financials, but this is a way of getting your back all those charges. The sector had fallen out of favor last year but in the last 2 months the big banks are staging a rally. Earnings are just around the corner and word is they will be good. This way you buy the basket instead of risking your money on picking 1.

$XLF is attempting to break 200MA again$XLF managed to reverse after filling the gap. Now it is on its 6th attempt to break over the 200ma

XLF/KRE pair tradind idea paid out!Soem days ago I highlighted an interesting chart pattern related to the pair XLF/KRE, mentioning that AMEX:XLF could soon outperform AMEX:KRE . Well it turned out very well.
Follow me to get fresh pair trading ideas!

XLF overbought correctionEntry 25.70
Target bottom of channel
Stop- break through trend line around 26.50

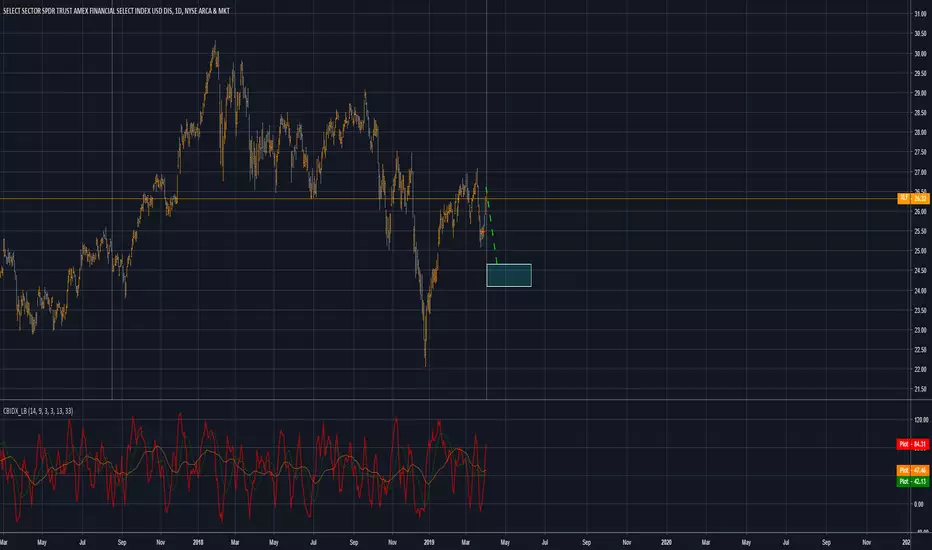
XLF, Financials Signal a Trouble AheadXLF is an ETF that tracks the financial sector - one of the largest sectors in S&P. The chart reflects a strong rejection from a major HVN (high value node) as well as the level where the downside conviction had started back in December 2018.
The price has closed right at the edge of the large value area. Usually, a bounce is expected. If the level gets accepted the price will start climbing up back to the top of the box otherwise we may see filling the gap and retest of the next box down below.
2 Major sectors Financial and Technology keep the S&P at higher prices, one of them has started to show its weakness. If the Technology starts to follow we will see a significant weakness of the index.

XLF Financials in troubleKeep an eye on the rate inversion and financials. If this inversion gets worse or if financials break support then it's game over for the market.


The #Fed Is Saying the Cycle Is DoneToday's FOMC minutes, and subsequent conference, was enlightening. The Fed has signalled that there will be no additional hikes in 2019, which the market had already priced in. Additionally, the Fed's quantitative tightening ( balance sheet reduction) will be tapered and expected to end by the end of September.
The bid-to-risk was short lived as the SPY and DIA closed negative, and QQQ was well of session highs. There was a frantic bid to treasuries, which The Macro Strategist have been advocating for months. Cyclicals have lagged the 2019 rally, and they received no solace from Powell & Co.
The problem with the Fed's complete withdrawal from monetary tightening comes at a time when, much like ECB's Draghi, was forced to admit the best of growth and inflation are beyond us.
Financials were slammed post-FOMC, and they will test minor-rally support of $25.86. The near-term TACVOL range sits 26.99/25.88 while the intermediate range 28.19/23.07 which would target to the downside.
Notice, XLF is tracking the eurodollar 2019 lower ready to price a lax Fed.
