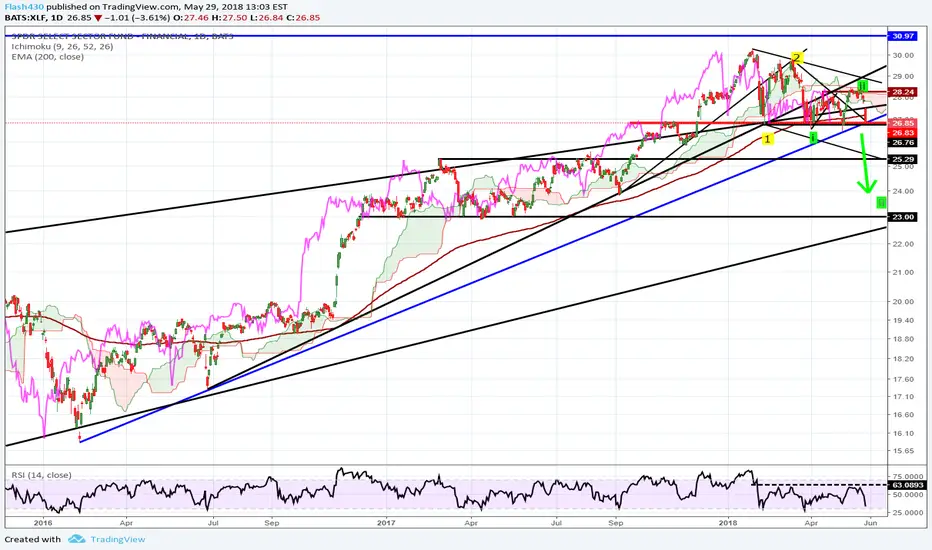
$XLF long-term bullishO a start position on $XLF June 2019 $30 calls, as I cannot exclude the possibility of XLF starting a FOMO run up (route blue)
Although, since that in short-term SPX and QQQ do not have much room, I tend to think route green has a higher chance to happen, and (if route green comes true) I will buy the dip hard on $27.5 area.
XLF trade ideas


XLF Has Its Pre Financial Crisis High In SightsThe popular ETF, XLF follows the financial sector and after weeks of selling, it looks to have found support and be gearing up for a big move indicated by the Weekly Squeeze coiling for the past 8 weeks, with the momentum shifting to bullish this week. If you take a look at C (Citigroup), it too has a Weekly Squeeze. If you take a look at it on a Daily it also has a Squeeze which looks like it will fire long. If this move for the financial sector plays out long, I would expect a retest of its high back from January (30.33) then a retest of it's high of 30.84. This high (30.84 - May 28, 2007 - 11+ year ago) is an important one because this was the peak of the financial sector ETF ( XLF ) before the financial crisis of 2008.

XLF - sub-fractal identifiedXLF is potentially in a pretty bearish posture but I give it allowance for one more pop into the orange box specified. After that I would be short. I don't like the setup to be long here.
It is very interesting that my fractal identification method has picked out a sub-fractal if you will -- i.e. a pattern in the daily, which has previously presented itself in the hourly.
If I overlay that onto the daily chart, I see we should pop into one more high before turning down


XLF - FinancialsLooking for a cashflow trade in the smaller accounts.
Sold -1 Jul20 $27 put for $.60. I will continue to wheel, roll, and cashflow this as long as I can.

XFL LongPossible long opportunity XLF, bullish triangle continuation.
BUY the break-out above $27.80ish mark

XLF finding support, ready to go ahead of Big Bank EarningsOld resistance acting as support for XLF, earnings reports for big banks begin Friday, 7/13. Option shown on chart for long position, current bid/ask. GLTA.

Death Crosses AboundA few sectors are signaling troubles ahead, with their 50 day MA's crossing below their 200 day MA's.
This chart picture shows SPY (upper left) as a broad gauge of market action. It has yet to experience the "death cross."
However, the industrial stocks measured by XLI (upper right), materials stocks measured by XLB, and financial stocks measured by XLF have all experienced the death cross. Given their importance as a proxy for future growth, this seems to bode poorly for broader markets.

Buy the Banks, Suckers!Every time I turn on CNBC, FBN, or the like, I hear a pundit or analyst pounding the table to "buy the banks." The go on to ramble a spiel about low valuation rations (P/B, P/E, P/FCF, etc), rising rate environments, yield curve inversions, and other reasons that they should outperform the markets going forward. But who's biting?
A quick glance at the SPDR financial ETF - XLF - and you will likely arrive at the conclusion that this is a sell, not a buy. We've broken short term trends (red dotted lines), intermediate term trend (orange dotted line) from 2016 lows, and are approaching a trend line (green dotted line) from the recession lows nearly a decade ago. Even worse, it looks to have formed a double top at the $30 level, the first peak coming in 2007.
Until there's a bid to reverse trend, this is a hard sell. Support looks to come in around $25. If that fails, the next support is around $21, but that's crash-level support.
Of course, one must ponder... if the banks are rolling over, how well can the broader markets hold up? Is this the warning shots of a larger correction in the markets? Hmm...


HAS THE XLF (LARGE BANKS) PUT IN A DOUBLE TOP ?Does the double top in the-XLF warn us of an economic slow-down?
The US Industrial stocks are slowing, as well as the emerging markets and US large banks.
History teaches us to pay attention to longer trends, and the-XLF clearly has not been able to put in new highs.
Most of the indicators for the XLF-are slowing.
I think that this is forecasting an economic slowdown.
Use caution and don't chase story stocks.
Don.

XLF on the brink againXF financials/banks ETf on the brink again as it strains to maintain the 2 year+ uptrend from early 2016. Close below 27 area could lead to a swift 8%-10% more downside.
Leading the market lower post FOMC as 10s-2s yield curve flattens further

XLF Diamond Looks like a diamond to me, very similar to last year. Also works well with some harmonics patterns. Bounced off closing the gap that was created on the 6th today.


XLF make or breakexpected sell off on Tuesday, needs to snap back and break out of the broadening wedge to escape the downtrend. little bit of hidden bullish divergence which may help the cause

XLF needs a daily close below 26.80A daily close on XLF financial sector etf below 26.80 would break horizontal support and be the lowest close for 6 months and would also be a close below uptrend since 2016....BEARISH


XLF - Inside Bar formation w/ potential breakoutThe market has been consolidating after a strong up move. An inside bar pattern has formed during this pause and presents a good opportunity to get in on the next leg up. A good strategy would be to enter on an upside break of the inside bar with a stop loss just below the bottom of the inside bar pattern. It creates a very attractive risk/reward setup.

Short bullish pop then dropIn my opinion, looks like the weakness of earnings but temporary bullishness of SM will provide short term pop for financials to 28.2X then drop to lower support for next consolation leg down.
