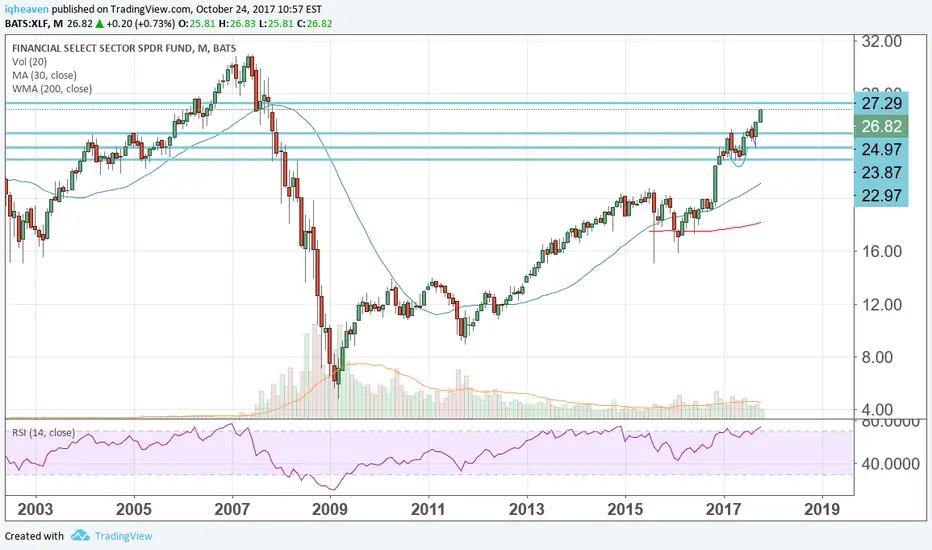
Heading towards levels seen before 2008's crisis Banks earnings, Trump and the Fed drove XLF back to where it was before the major financial crisis of 2008.
10 Years later, will history repeat itself?
XLF trade ideas


Altered target. Altered Graph. same - maybe better picture
slightly altered lasst grph
mucking around.
A


Uptrend Channel ETFWhen the price touches the support trend line , or the lower trend line, of an ascending channel , a buy trade is signaled. When the price touches the resistance trend line, or the upper trend line, a short trade is signaled. It is also important to pay attention to the volume of the stock. If the stock breaks support with high volume , it is a greater indication that the trend is broken. However, if the stock breaks support with low volume , it is okay to hold a little longer since it could be a false breakout. If you choose to hold a little longer, make sure you have a stop loss


XLF - a good barometer for banking stocks to buy/sellLook at XLF and GS, don't you think that they mirror each other in its chart pattern? I have find using XLF a good barometer to buy or sell banking stocks like Citigroup, JPM and GS. Again, XLF has shown temporary weakness with price action closing below 21EMA and a gap between 25.51 and 25.61 awaiting to be filled. 25.51 is slightly above the 50% FIB level which could potentially retrace and continue its bullish move. See my next chart for further explanation.


$XLF Is the Financial Pullback Something More? (includes video)U.S. financial stocks have been in pullback mode this week despite the SPX moving higher. Considering that financial stocks had been a big boost to market gains over the last several months, this could be concerning.
The XLF is down about 3% - and regional banks KRE down 6% - since the recent top. Let's put this move into context, shall we?
As MacroView as posted before, financial stocks really began to rally in early Sept just as the 10s/fed funds curve bottoms around 90 basis points. The correlation has been rather strong between .65 to .93.
In our view, the curve and financials rallied on two things: markets were trying to price higher inflation (we saw this as the long-end steepened) vis-a-vie higher commodity prices. Then, markets were anticipating Pres. Trump nominating John Taylor as the next fed chair, who would be uber hawkish.
We were happy to take the other side of that bet. Powell is dovish. In turn, we saw yields and copper, particularly, head lower.
The 10s/fed funds rate topped out at 131 basis points and began to trade lower on the above events. Price action in XLF and KRE weakened and the pullback ensued.
Click the here to listen to where support may be found and whether or not financials and the curve will rebound.
Check us out on twitter @macro_view

XLF Bear Divergence Top of ChannelShorting down to previous breakout level if further signs of weakness are shown. Ran too far too fast.
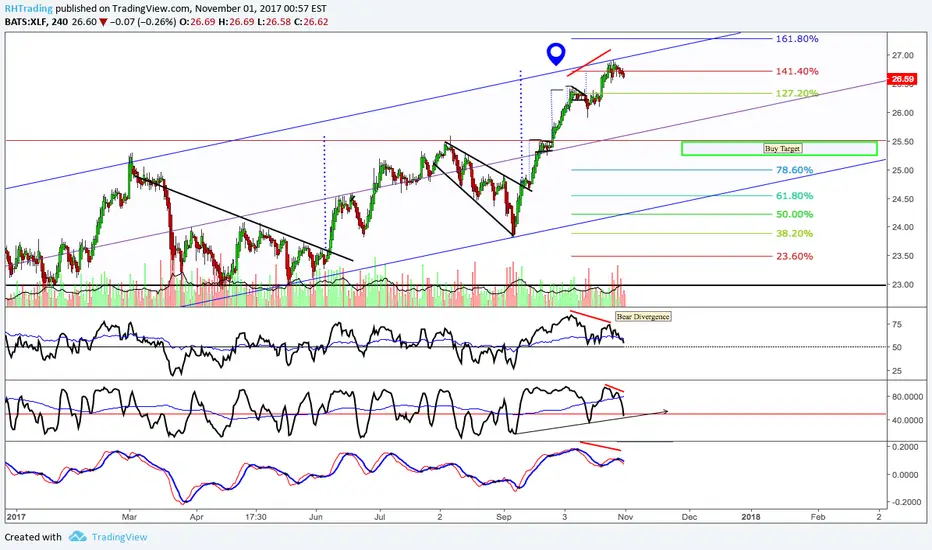
XLF - Ascending channel, brokeout of boxXLF broke out of 10 month range. Now in an ascending channel.

XLF Hits Target of 26.69XLF has reached its minimum target of 26.81. So far HSI and Amp RSI show no signs of an impending reversal.
Thus this would be a time to consider taking some profits off the table but not to take a short.
Amp RSI in particular shows extreme overbought behavior which suggests price needs time before a reversal can happen.
Check my twitter account for more details: @KeeganHT


Financial Bull FAS XLFHave some runners in FAS, waiting for a little pullback to the red arrow to reload.


