Long FinancialsWeekly charts: the XLF/SPY ratio has bounced off the 61.8% fibonacci retracement level of its major long term move started in 2011. Hammer pattern has formed on heavy volume on an absolute basis. Real opportunity to enter in the financial sector.
XLF trade ideas

lets see if this monthly TL holds ... if not CoCo it is...lets see if this monthly TL holds ... if not CoCo it is...


XLF LongWith the rise in rates by the FED the
margins at the banks and credit card
companies will improve. I look for the
banks to become more favorable on
the street

MACRO VIEW: XLF AT MACRO UNCERTAINTY, STILL RECOVERING FROM 2008Financial SPDR ETF is still recovering from 2008 losses and did not make it back in terms of prices.
On long term basis - XLF has only recently crossed back the 10-year mean upwards (now at 21.50) and have been in 5-year uptrend until the recent August selloff. Currently it is trading within 1st standard deviation from 5-year mean, showing no macro trend.
On short term basis - XLF is also showing no trend, as the price is trading within 1st standard deviations from 1-year and quarterly means.
In summary, the 5-year uptrend will resume only after price will cross back 24 (5-year uptrend border). Until then, trend is lateral.

XLF - Squeeze release soonWith a massive squeeze on 4 timeframes (4hr/6hr/1D and 1W), XLF is poised to make a big move (In the chart, blue candles are all TF squeeze candles).
Squeeze release is usually accompanied by a fakeout, so need to be careful there, but based on other momentum indications, good chance of this breaking up. Breaking up that RSI resistance will be a good confirmation.
First target is 25.8 level.

TL breach watch at closeto believe in this rally. 'Financial' support needed for everything in life:)

XLF Financial Sector: Weekly linear: XLF Topping Soon??Although the DJIA and the SPY keep making new highs, the XLF hasn't quite made a .618 correction. This in itself would indicate some weakness and indicate that when or if a major bear market develops it may be a big loser. The way I see the price action from the 2009 low to now is a A-B-C correction with the B wave the form of an expanding triangle. Using this concept it forms a good looking (to me) channel. One fairly common relationship is for the C wave to be a fib relationship to A. Commonly C=A, or C=.618x A, or C=1.618x A. Another somewhat common occurrence is for a correction to be a .618 retracement. Both of these may occur soon at the rectangle labeled C? I will be watching this action the next few weeks for signs of a reversal then go short. Hope this is helpful. Have a great upcoming week.

XLF $24.17: Forms a 6-month symmetrical triangle patternXLF has been consolidating within a 6-month symmetrical triangle pattern (from October
15, 2014 low and December 29, 2014 high). The key support lies at 23.78 (March 26, 2015 low), near the triangle lower bounds and the 200 day moving average currently at 23.64. While the 23.78/23.64 support area holds dips, if bulls manage to reclaim 24.54 decisively (April 16, 2015 high near the triangle upper bounds), that would suggest a triangle breakout and trigger further gains towards 24.78 (March 23, 2015 high) then 25.14 (December 29, 2014 record peak). However, a breakdown below the 23.64 support area would signal topping and weaken towards 22.89 (February 2, 2015 low).
Outlook:
Short term: neutral
Long term: bullish while above the 200 day moving average


XLFVery Bullish here on 4 hr. Look for "Mattress of Resistance" to get breached today. Good for overall mkts.

Will the financial settle with this pullback? Financials, which have been driven higher by the Fed and the ECB, is in an interesting sell zone.
We have minor structure level as well as the top of a rising Wedge.
We've already seen false breaks in both sides of the Wedge as the ETF ranged from 25$ to 23$ and now, judging by the decrease in volume $XLF may be setting up towards its next strong move.
Above 24$ we will probably see the re-test of previous highs and even new high. I don't like the R/R for the upside trade.
The bearish setup here is to trade the sell zone and place a stop loss above previous high. The potential targets (if the price will break below the lower trend line (dashed green) will be the 200 SMA line and the 22$ support zone

XLF is on the way to touch 100SMALets take advantage of this downtrend!
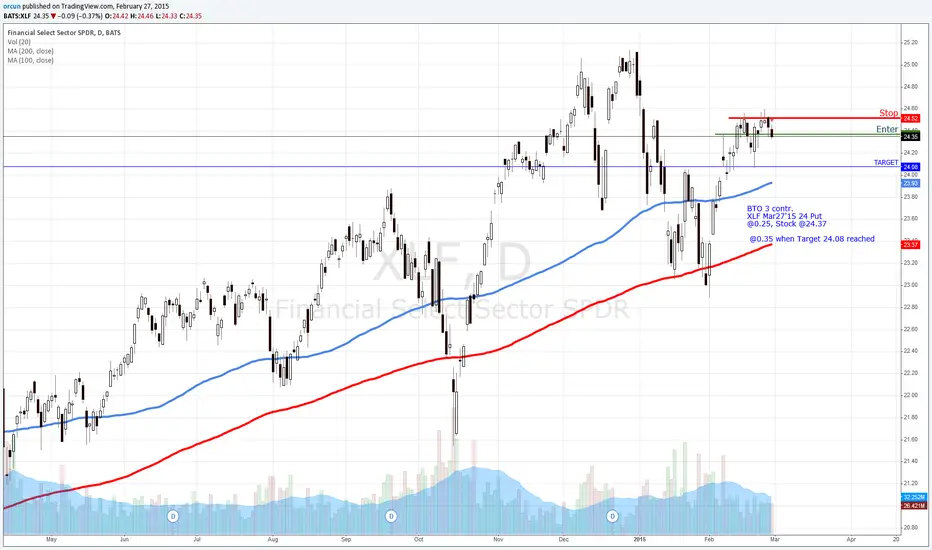
BTO 3 contr.
XLF Mar27'15 24 Put
@0.25, Stock @24.37
@0.35 when Target 24.08 reached


XLF - March SeasonalityThe Seasonal impact on XLF during March is Bullish. Wish, I have the time to code this seasonality here on tv, unfortunately, that wouldn't be a free tool.


XLFNotes on chart. Double Top is confirmed here. A bounce to 100dma is possible to work off oversold conditions. Measured move is 22.38ish

US financials - Room for relief and DOWNIt could have fallen from Oct13...
Instead, it has managed to grind in a narrow channel for a year.
Probably a short after a few weeks neutral bias up.

A healthier view of XLF; and a thought on ETF trendsPerhaps regression channel lines are more appropriate to trend touch lines for ETFs.
This channel and trend are in response, and submitted as alternative, to the recently posted XLF "broken trend" case.

XLF, healthy uptrendline broken twice in 3 months, still healthyi begin to doubt the health of this uptrendline
