XLU trade ideas

Pullback late enterPullback with long last candel, which hurts enter point. Possibility for price to go up today.


XLU breaks out of a long-term rangeIf XLU stays above this range, you can be sure the fear trade in the market is intact.

Sell Bias on the bounce back - #ProfitingMeHi,
the trading scenario suggests a Sell opportunity on the top in this price consolidation... if it will be possible.
Thank you
Girolamo Aloe - profiting.me

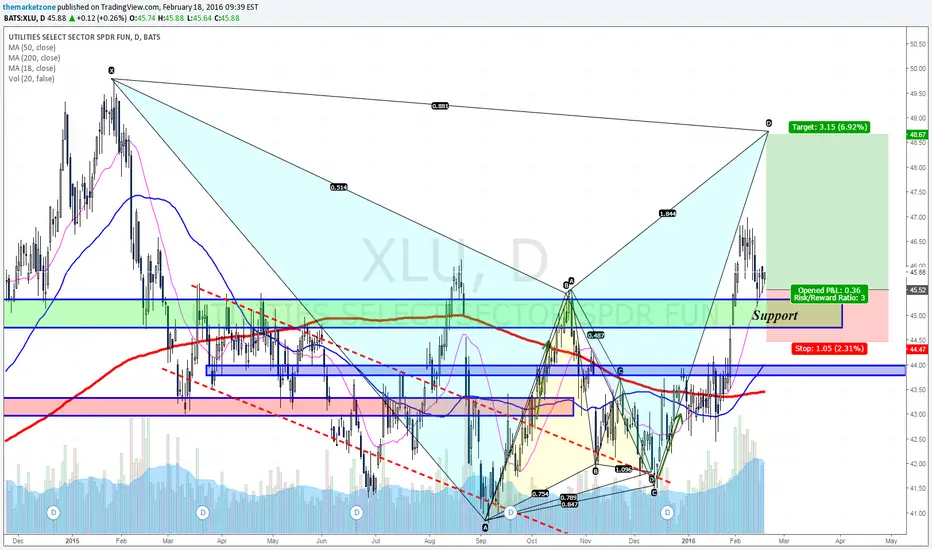
Another 61.8 Fib pullback inside the PRZ$XLU continues to range inside the PRZ of a Daily Bat pattern.
Two successful sells I had on this one..
Will the third one be the one that will lead $XLU to its final destination? 45-46$ is my final target zone for this setup
Tomer, The MarketZone
Follow me on TradingView
Subscribe to my newsletters - goo.gl
Follow my blog - goo.gl
Subscribe to my Youtube channel - goo.gl

Bat pattern completed The Bat pattern I've mentioned in the past for $XLU was completed last week.
As you can see there was minor bearish reaction to my harmonic sell zone.
$XLU is very close to 50$ so we may see it try to touch this psychological level.. that's usually what happens.
The bearish scenario for $XLU requires a stop loss above 50.5$ with nice R/R as I aim for 47$ as my first daily target zone and 45$ as secondary
Tomer, The MarketZone
This analysis is part of the Weekly Markets Analysis newsletters
To read more interesting technical reviews for the week goo.gl
To subscribe to the newsletters - goo.gl
Follow my blog - goo.gl
Subscribe to my Youtube channel - goo.gl

Ugly utilities breakdown and continuation on increasing volumeI think we could see 45.50 sooner than later
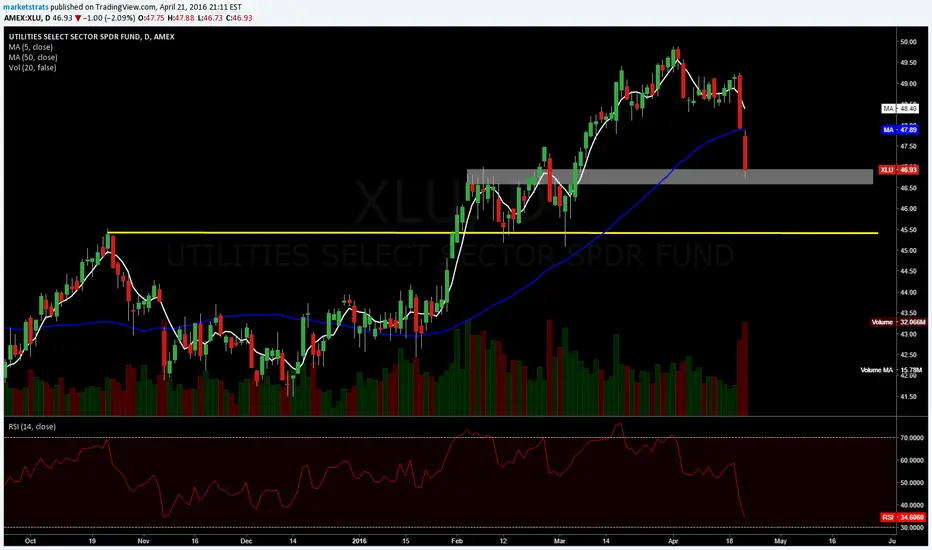
$XLU Pullback Coming$XLU hit its 1.618 extension.
I see no reason to be long at this levels.
Pullback expected towards the $46-47 area.

pennies to thousands short term short head and shoulders may retrace to 50 ma or cloud double top cci and percent r at bottom money flow decreasing mad and stoc crossed

Utilities (XLU) are toppish, correction expected.The XLU has recentlly reached it's high of early 2015 near $50 which seems to offer strong resistance. A double top seems to be in process. Elliott waves count of 5 waves is completed, a correction seems to have started towards the $46.70/$45.35 area, The wave III should just have started, a fast drop is expected.
RSI (5) and MACD are showing beairhs divergence and the XLU-0.20% is trading far away from its 200 days SMA (at $44.30).
The bond market is also showing a similar exhaustion pattern.

Markets ready for a short ? The overal market is weakening and approaching a riskwise interresting level to participate in a potential leg down
with:
->the sp500 approaching the supplyline of a pot. downchannel
->xly approaching its resistance
->xlp on a break of the demandline , retesing the broken resistance
->xle trading at its supplyline
->xlf forming a pot. lower high
->xlv struggeling gaining new grounds to the upside
->xlk trading near its resistance
->xlu trading near its resistance
riskwise shorting the sectors close to its resistance like XLU, XLK
and the sectors at their supplylines like XLE would be the best bet...
especially XLE which is the weakest sector of them all , would be a good candidate to participate in a short play

Ether a double top or a historic new high moment for UtilitiesReally? We are really counting on Utilities to lead the market by making a historic new high?

Continuation towards bearish Bat completion? $XLU is no doubt one of the strongest sectors out there. The bullish setup from 41$ generated impressive rally in time where the markets suffered mostly losses.
Now, as sentiment starting to shift, we may see continuation move towards final target zone of the bullish move - Completion of Bat pattern near 49$
Two zones to monitor in $XLU:
1. 45$ - Currently support (we see that the price is bouncing on it for now.
2. 43-44$- Structure and the daily 200 MA line
Tomer, The MarketZone.net
Follow me on TradingView
Follow my blog - goo.gl
Subscribe to my mailing lists - goo.gl
XLUdownward movement based on 2 red heiken candles as well as downturn of RSI and MFI as well as MACD


XLU/SPY dont sell yet . is poised to continue and outperformyields of bonds will be even lower, right after the reliefe rally is over.
mabye more QE around the world ?

XLU/SPY Bottom Forming Why would investors search for yield in the Utilities market $XLU ?
Because, they are not able to find it in the broad market.
This chart is very troubling for US Equities.

$XLU Are Utilities Giving Us a Clue to the Broad Market?A break above the black channel could spell trouble for equities.

Bearish bat on XLUXLU is forming bearish BAT pattern. Watch that channel and D-point for possible downward action. Stops above X and no entry if it keep rising or news events disturb it. Targets eg. B-point and C-point or fib. ret. 38,2% and 61,8% of the CD-leg.

MACRO VIEW: XLU STRUGGLING TO GET BACK INTO MACRO UPTRENDSXLU - the SPDR utilities sector ETF is struggling to get back into macro uptrends, while showing no bias on short term.
On long term perspective the price is trading around upper 1st standard deviation from 5-year mean, which is a 5-year uptrend border. The price is also technically in 10-year uptrend, trading above the upper 1st standard deviation from 10-year mean.
Thus one can only say that XLU has restored its long term upward bias if it trades firmly back above 44.
On short term basis price is trading within 1st standard deviation from both 1-year and quarterly mean, showing no directional bias at the moment.

XLU LONGXLU has been one of the strongest sectors over the last month on anticipation of no rate hike.
It is breaking out but is still developing IMO as the rate hike is still in question
moreover it is up against the kumo cloud on the weekly. Resistance area is my target
