CypherI have noted many are seeking out utilities for a bit of stability.
XLU is an ETF slammed packed with utilities. It is a product of the SPDR ETFs.
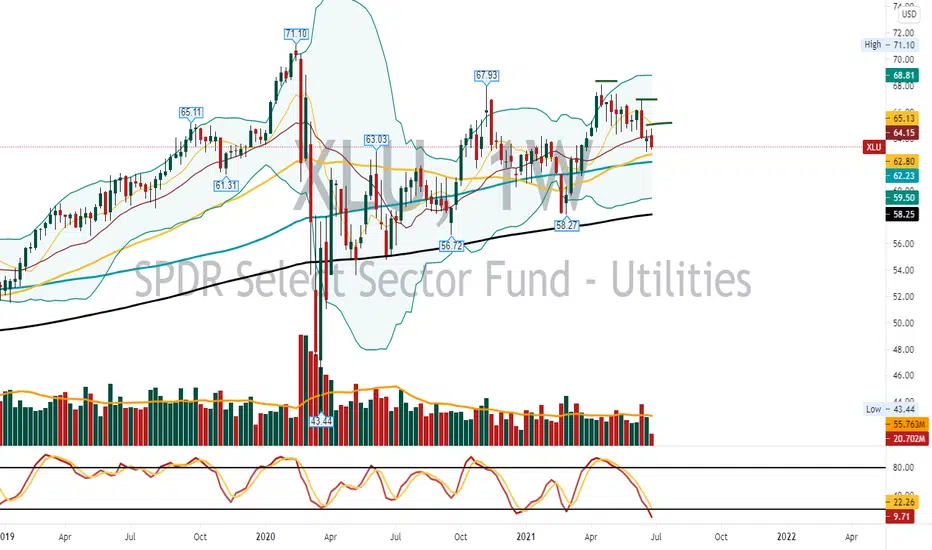
Cypher which has the 2nd leg retracement pull between the .382 and the ,618 This one appears to have pulled to the ,618. Labeled XABCD and stop is below D somewhere. Peak 2 is higher than peak 1.
This could be safer than individual utility stocks and the dividend is good. Little more reach for the .786 of XC which is where the cypher lands. Patience is a virtue.
No recommendation.
Gap noted on XA which could serve as support.
Yield is 3.18%
Top 10 Holdings
NextEra Energy Inc
18.15%
Duke Energy Corp
7.99%
Southern Co
7.20%
Dominion Energy Inc
6.30%
Exelon Corp
5.60%
American Electric Power Co Inc
4.44%
Sempra Energy
4.19%
Xcel Energy Inc
3.61%
American Water Works Co Inc
3.40%
Public Service Enterprise Group Inc
XLU trade ideas

December to date sector performanceXLU = Utilities +5.27%
IYR = Real Estate +3.10%
IYT = Transportation +1.57%
XLF = Financial +1.51%
XLC = Communication +1.19%
XLK = Technology -0.32%
IBB = Biotechnology 0%
XLE = Energy -0.59%
SMH = Semiconductor -3.17%
XRT = Retail -6.15%
Do your own due diligence, your risk is 100% your responsibility. This is for educational and entertainment purposes only. You win some or you learn some. Consider being charitable with some of your profit to help humankind. Good luck and happy trading friends...
*3x lucky 7s of trading*
7pt Trading compass:
Price action, entry/exit
Volume average/direction
Trend, patterns, momentum
Newsworthy current events
Revenue
Earnings
Balance sheet
7 Common mistakes:
+5% portfolio trades, capital risk management
Beware of analyst's motives
Emotions & Opinions
FOMO : bad timing
Lack of planning & discipline
Forgetting restraint
Obdurate repetitive errors, no adaptation
7 Important tools:
Trading View app!, Brokerage UI
Accurate indicators & settings
Wide screen monitor/s
Trading log (pencil & graph paper)
Big, organized desk
Reading books, playing chess
Sorted watch-list
Checkout my indicators:
Fibonacci VIP - volume
Fibonacci MA7 - price
pi RSI - trend momentum
TTC - trend channel
AlertiT - notification
www.tradingview.com

UtilitiesA very mild uptrend with a major resistance @feb 2020 highs. Rather a defensive sector, but very linked to PMIs

XLU Test of the ATH!XKU gaining strength
A test of $70 is exp. - or to new highs.
act. structure shows no potential for a bigger downmove.
hm.. let´s see.

XRT weekly Wolfe Wave bearishA Wolfe Wave is a chart pattern composed of five wave patterns in price that imply an underlying equilibrium price. Investors who use this system time their trades based upon the resistance and support lines indicated by the pattern.

$XLU with a potential sideways C&H!Not the most exciting sector, but it has been known to move. Worth watching at these levels.

Long XLU short IWMIt is time to go defensive again. ISM PMI declining from expansion, historical high percentiles of distribution. US10Y going down together with ISM. Long Utilities as defensive sector, short IWM small-caps high-beta assets.
Best,

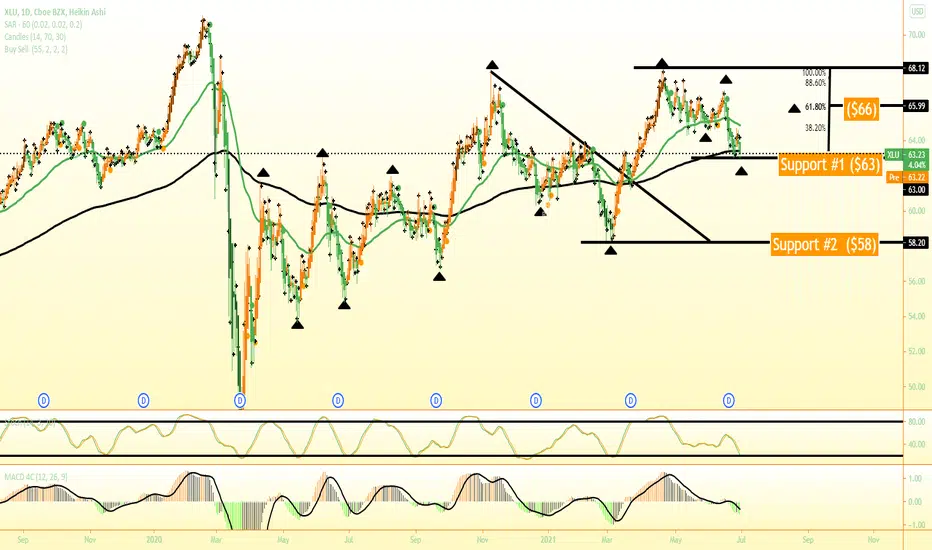
XLU to Outperfom Broad market valuations are stretched beyond the historical averages, growth and cyclical technicals are in overbought conditions on many time frames, in addition key economic indicators are turning down as it appears we are mid cycle transitioning into phase 3 of the business cycle where we tend to see defensives, bonds and the Dollar outperform as the yield curve flattens. Yields are pushing lower as market participants price in a Fed policy error as tapering begins this month.
From a technical perspective, XLU is trading near its key moves averages which are stacked at $66, XLU put in short term double bottom at $63.50 back in early October and is currently in a bull flag formation, I expect continuation to the upside as market participants seek protection and yield. In addition, XLU/SPX is trading at a key support in a falling wedge signaling outpeformance in the near term.
Profit Target 1: 71 (previous all time highs)
Profit Target 2: 78
Utilities tend to move parabolic before a broad market decline. $78 target would be a blow off top scenario.
___________________________
✅ If you found this idea useful, hit the like button, follow & share.
✅ Follow for swing ideas, trade setups and weekly 0DTE income trades.
✅ Don't hesitate to post comments, opinions and questions.
💸 WHAT IS 0DTE TRADING?
The Chicago Board Options Exchange (Cboe) lists weekly options on the S&P 500 Index (SPX) with expirations every Monday, Wednesday, and Friday. Most options expire worthless and we take advantage of this by selling credit spreads to collect premium. This strategy allows us to profit if the market moves up, down or doesn't move at all. See profile to learn more!

Basic ChartingHere is a video going over some charts using basic TA skills
stocks:
rblx, cat, lmt, xlu
expectopatronum!

Market "Risk Off" indicators warranting attentionThe long-term stock market trend unquestionably continues to be an upward one. However, there are seasonal and other factors (such as market breadth, etc) that may be pointing towards a potential pause or reversal.
Since no single indicator is fool-proof, a "weight of the evidence" approach is always warranted. Such an approach ideally includes a variety of indicators that could offer an advance signal of a switch from "risk on" to "risk off" environments. One such measure to consider in your toolbox is how defensive equities such as Utilities (typically sought out for their yield) are faring against the broader equity market. The accompanying relative strength measure plotting $XLU against $SPY has broken trend and reversing upward for the last several weeks. Again, not overwhelming by itself, but when coupled with other indicators (such as previously posted JNK or XLP updates) it warrants continued monitoring in the coming weeks.

Short term upswingNo fundamental support.
Just technicals and hopes.
Don't follow my idea without doing your research.

XLU, Immediate term trade and trend [08OCT2021]XLU went strong bearish. I love to add this to short side of my portfolio, but my broker doesn't unfortunately allow it.
Then why do I track it? well, The code tracks sectors and ETFs to give a current weather of the market.
From what I can see so far, we are headed to another liquidity rush. Where, Equities make new all time highs.
If you can add it to the short side, I would suggest also adding XLF to the long side, along with a small XLK position too.
Let's see how this plays out
Redd

XLU at the bottom of the channelThis has traded within a channel for over a year. No reason to think it won't continue.


XLU looking for Fibonacci extension.Utilities keeps pushing higher and is looking to be chasing for the extension to the 1.272 fib. This is a long term play that I have been looking at for a while now.

XLUInvestors appear to be taking risk off as they move into Utilities. XLU continues to move higher; weekly RSI is approaching 61.8 level. This level provided strong resistance over the past year or so. Therefore, a move past that level would be significant.

XLU short at 66.18Staying short Weekly heading down been taking profits on way down look lower highs
Utilities love both quads 3 and 4Given that is where we are headed (quad 3 or 4), I 'll be looking to build a position here. I'll specifically be looking for a momentum swing on the oscillator as a signal the regime turn is happening, or in fact in.

XLU shrt at 66.18Staying short XLU
Daily says snap back into down trend, under 50 day ma sitting on 100 day ma. Look at vol more selling then buying
Weekly says stay short


XLU shrt at 66.18Daily stoch on bottom lots selling vol
should bounce off 100 day ma took some profits today not all
perfect bounce
Weekly looks great stoch heading south nice lower highs lower lows

Staying short XLUDaily lower lows lower highs, stoch going south
vol nice. That may bounce off 100 day , but it breaks we drop.
Weekly just pretty trend is down
