xlv + xle + xlu --- Low relative strength - China Deal???How would this look different if a Trade deal were imminent....
XLU trade ideas

XLU - Short-term broadening formation pullbackXLU is in a broadening formation within a long-term bull channel. Finding support at the 50 day moving avg.

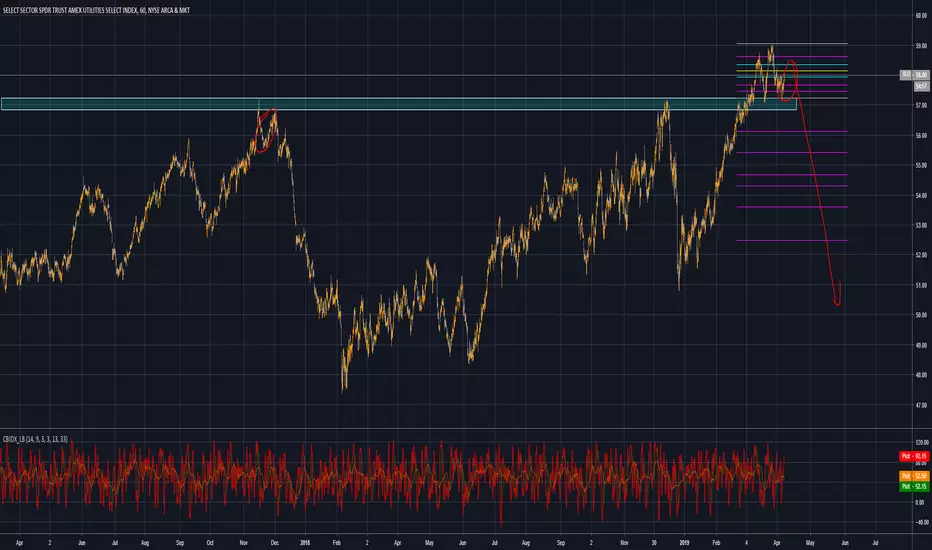
XLU possible meltdown to signal risk-on melt-on ala early 2018Think we could really melt down in XLU shortly, and that would result in a bit squeeze of indices like in 2018. Just hypothesis currently
XLU Bearish OutlookBear Case:
*Forming H&S
*Massive RSI Divergence
Bull Case:
*China
*** Looks like XLU might look to form a H&S, but based on how heavily the RSI has dropped, it might not even bother and just drop. In either case, Short the top of the Right Shoulder or a break of the neckline .... Let's talk about it! ***


XLU Utilities leading this bull run?With the market exploding upward since the end of Dec with V bottom and look at which sector is ready to go to all time highs.
I'm guess most traders don't see interest rates going up any time soon.

$XLU BearishNearing the end of this rising wedge, XLU daily candles last week are struggling to make any new highs. MACD curling down. This looks like a good short opportunity.

XLU - Risk vs Reward Assesment timeAt minimum, XLU looks to be ready to pull back. IF XLU is making the (b) wave, then (c) wave will take it all the way down. Either way, it's prudent to take profit and step aside.

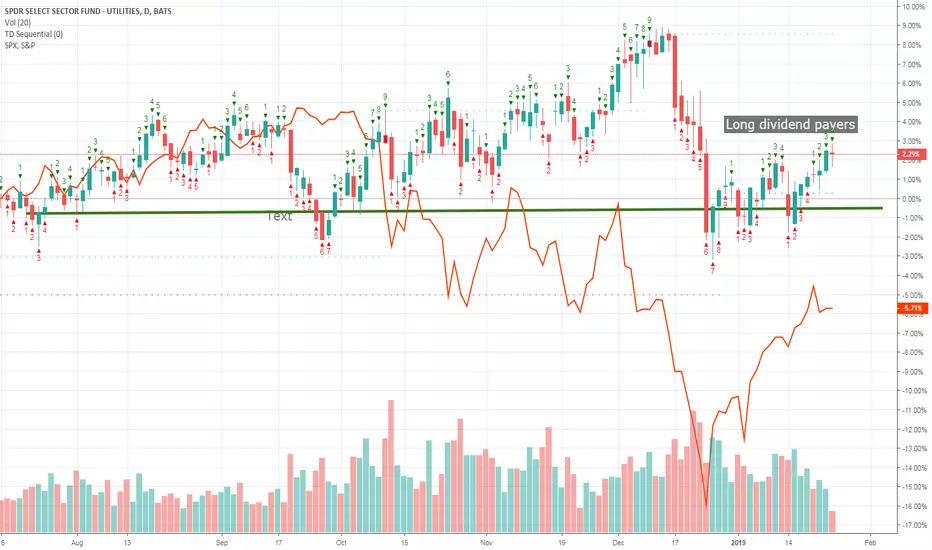
Utilities are back in playDividend payers within the Utilities sector are outperforming the S&P after its fall from grace
due to the PG&E bankruptcy.

XLU ShortUtilities always take a hit with rising interest rates. Here we are in a downtrend and a wedge triangle forms and cannot get past long-term support which has now become resistance. Targets at both at recent low for a quick two pints and then at next LT support and Fib extension at 48.58, for another ~ 2-3 points


Short XLUXLU has formed a double top.
Utilities have been a flight to some degree of less risk. However Looking back to 2008 and 2000 utilities were hit just like most other equities.
I believe that utilities are going to be hit again within the next year.
* This information is not a recommendation to buy or sell. It is to be used for educational purposes only.

XLU Defensive in clear channelThe XLU (Utilities ETF) is a well-known defensive (succeeds in troubled economies, you have to buy their product) and has a very clear channel. My trade enters at the bottom of the channel and so allows for further market weakness. The price only matched the previous top last time, so I am playing safe with that top as a target, rather than going to the top of the channel.

XLU (Defensive) Still in ChannelXLU, the SPDR Utility Sector is well-known, high div paying defensive, and has not broken support like SPY as a whole. Let's play safe with a 1.6:1 trade, with stop below the lower tramline and target the confluence high of the bullish and moderate cases, as shown by the regular and dotted lines. Aggressive traders could set the stop at 53.75, reflecting the 52-55% pullback last time.

XLU A VERT BEARISH FUTURE AHEAD It looks like we now have a double top so there is now no where to hide what is coming other that the 10 year or cash going into 2019

XLU Head and shoulder pattern?Possible head and shoulder pattern
Invalidation if not breaking rising wedge

XLU Bearish Divergence PatternsAMEX:XLU seems to develop bearish divergences that push the price down towards this bullish trend line (in the purple). The bearish movement could take some time to develop. We could see more bullish movement in the short term.

XLU, Buy weaknessIn an environment of declining rate and stocks prices, Utilities are a sector who tend to outperformed. With 10 year US rate heading to 3,00% and stocks much lower, XLU can be a good bet against general index

Why you buy Utilities in a slowing growth environmentUtilities have started to outperform, meanwhile other sectors are underperforming. Just looking at history, you only have to go back to 2015-2016's industrial mini recession and EM recession to see how utilities outperformed other sectors. During this time, $XLU rose 25% while the S&P was flat, and technology / other cyclicals were all negative.
Cyclical sectors had their time, now utilities get to shine as other sectors get hit hard.

XLU - UtilitiesBuying into the weakness here in XLU, with a synthetic covered call set up.
-1 Nov16 $54 put for $1.87 cr.
