XLV BreakoutThe XLV is breaking out after testing the $147-$148 area as resistance since late February. It finally broke out recently and came back down to retest the area as support yesterday, successfully. 1st Upside target is $157, followed by $162 for a secondary target. As markets are falling this week, healthcare typically does well in a bear market, so this breakout makes sense. Also, volume has gone up with the breakout, confirming price action
XLV trade ideas

$XLV – Bearish Options TradeTook a defined-risk, bearish position targeting $124 by mid-June.
Set up for max loss if wrong — thesis based on price action + macro bias.
Let’s see if it breaks down.
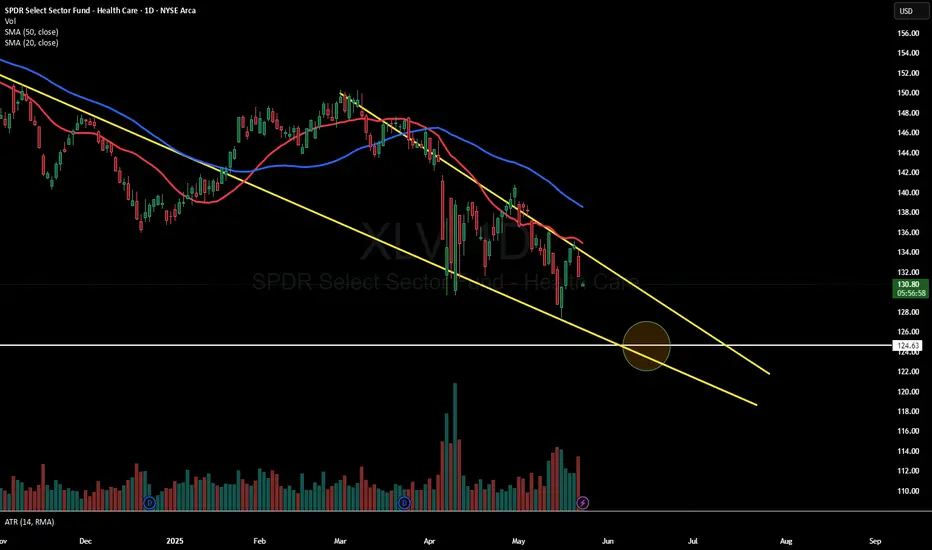
XLV Stock Chart Fibonacci Analysis 061025Trading Idea
1) Find a FIBO slingshot
2) Check FIBO 61.80% level
3) Entry Point > 136/61.80%
Chart time frame:D
A) 15 min(1W-3M)
B) 1 hr(3M-6M)
C) 4 hr(6M-1year)
D) 1 day(1-3years)
Stock progress:B
A) Keep rising over 61.80% resistance
B) 61.80% resistance
C) 61.80% support
D) Hit the bottom
E) Hit the top
Stocks rise as they rise from support and fall from resistance. Our goal is to find a low support point and enter. It can be referred to as buying at the pullback point. The pullback point can be found with a Fibonacci extension of 61.80%. This is a step to find entry level. 1) Find a triangle (Fibonacci Speed Fan Line) that connects the high (resistance) and low (support) points of the stock in progress, where it is continuously expressed as a Slingshot, 2) and create a Fibonacci extension level for the first rising wave from the start point of slingshot pattern.
When the current price goes over 61.80% level , that can be a good entry point, especially if the SMA 100 and 200 curves are gathered together at 61.80%, it is a very good entry point.
As a great help, tradingview provides these Fibonacci speed fan lines and extension levels with ease. So if you use the Fibonacci fan line, the extension level, and the SMA 100/200 curve well, you can find an entry point for the stock market. At least you have to enter at this low point to avoid trading failure, and if you are skilled at entering this low point, with fibonacci6180 technique, your reading skill to chart will be greatly improved.
If you want to do day trading, please set the time frame to 5 minutes or 15 minutes, and you will see many of the low point of rising stocks.
If want to prefer long term range trading, you can set the time frame to 1 hr or 1 day.

$XLV - Long Calls (Sept)I picked up calls for September based on price action and key control levels. The stock has been in a downtrend and recently tested significant support levels on both a monthly and weekly basis. Considering the slow price movement and that the recent decline was driven by fundamental factors, I'm targeting a rebound back to the monthly high from May.

Short Setup for Weak Healthcare Sector- Current Price: $132.68
- Price Targets:
- **T1**: $129.66
- **T2**: $127.98
- **S1**: $134.70
- **S2**: $137.56
- Recent Performance:
Healthcare Sector ETF (XLV) has declined 4.22% in the past week, breaking
beneath key support levels. On an annual basis, the ETF has plunged 29%,
reflecting sustained weakness in the healthcare industry. Biotech has been the
hardest-hit subsector, exacerbating XLV’s bearish trend. The ETF’s short- and
long-term underperformance positions it as one of the weakest sectors within the
broader market.
- Expert Analysis:
Bearish sentiment across healthcare continues to dominate, with biopharma
declines further weakening investor confidence. Experts warn against
anticipating recovery absent substantial fiscal stimulus or regulatory
incentives for the sector. Breaching support of $131.56 signals an elevated risk
of further selling pressure unless sentiment reverses drastically.
- News Impact:
No noteworthy catalysts or events have emerged to counteract healthcare’s
sector-wide weakness. Investors should remain vigilant toward earnings reports,
governmental changes, or policy adjustments, as these could present upside risks
or exacerbate downside trends.

XLV Stock Chart Fibonacci Analysis 042925Trading Idea
1) Find a FIBO slingshot
2) Check FIBO 61.80% level
3) Entry Point > 135/61.80%
Chart time frame: C
A) 15 min(1W-3M)
B) 1 hr(3M-6M)
C) 4 hr(6M-1year)
D) 1 day(1-3years)
Stock progress: A
A) Keep rising over 61.80% resistance
B) 61.80% resistance
C) 61.80% support
D) Hit the bottom
E) Hit the top
Stocks rise as they rise from support and fall from resistance. Our goal is to find a low support point and enter. It can be referred to as buying at the pullback point. The pullback point can be found with a Fibonacci extension of 61.80%. This is a step to find entry level. 1) Find a triangle (Fibonacci Speed Fan Line) that connects the high (resistance) and low (support) points of the stock in progress, where it is continuously expressed as a Slingshot, 2) and create a Fibonacci extension level for the first rising wave from the start point of slingshot pattern.
When the current price goes over 61.80% level , that can be a good entry point, especially if the SMA 100 and 200 curves are gathered together at 61.80%, it is a very good entry point.
As a great help, tradingview provides these Fibonacci speed fan lines and extension levels with ease. So if you use the Fibonacci fan line, the extension level, and the SMA 100/200 curve well, you can find an entry point for the stock market. At least you have to enter at this low point to avoid trading failure, and if you are skilled at entering this low point, with fibonacci6180 technique, your reading skill to chart will be greatly improved.
If you want to do day trading, please set the time frame to 5 minutes or 15 minutes, and you will see many of the low point of rising stocks.
If want to prefer long term range trading, you can set the time frame to 1 hr or 1 day.

Trading idea - Entry point > 136/61.80%Trading Idea
1) Find a FIBO slingshot
2) Check FIBO 61.80% level
3) Entry Point > 136/61.80%
Chart time frame: D
A) 15 min(1W-3M)
B) 1 hr(3M-6M)
C) 4 hr(6M-1year)
D) 1 day(1-3years)
Stock progress: A
A) Keep rising over 61.80% resistance
B) 61.80% resistance
C) 61.80% support
D) Hit the bottom
E) Hit the top
Stocks rise as they rise from support and fall from resistance. Our goal is to find a low support point and enter. It can be referred to as buying at the pullback point. The pullback point can be found with a Fibonacci extension of 61.80%. This is a step to find entry level. 1) Find a triangle (Fibonacci Speed Fan Line) that connects the high (resistance) and low (support) points of the stock in progress, where it is continuously expressed as a Slingshot, 2) and create a Fibonacci extension level for the first rising wave from the start point of slingshot pattern.
When the current price goes over 61.80% level , that can be a good entry point, especially if the SMA 100 and 200 curves are gathered together at 61.80%, it is a very good entry point.
As a great help, tradingview provides these Fibonacci speed fan lines and extension levels with ease. So if you use the Fibonacci fan line, the extension level, and the SMA 100/200 curve well, you can find an entry point for the stock market. At least you have to enter at this low point to avoid trading failure, and if you are skilled at entering this low point, with fibonacci6180 technique, your reading skill to chart will be greatly improved.
If you want to do day trading, please set the time frame to 5 minutes or 15 minutes, and you will see many of the low point of rising stocks.
If want to prefer long term range trading, you can set the time frame to 1 hr or 1 day.

Healthcare Is Leading the Market This YearBelieve it or not, healthcare is the top performing sector so far in 2025. (It’s up about 9 percent, according to TradeStation data. That puts it fractionally ahead of financials.)
Today’s chart of the SPDR Select Sector Health Care ETF highlights some potentially interesting patterns.
First is the rally from January 3 (first Friday of the year) through February 5. XLV pulled back to retrace almost exactly half the advance, which may suggest direction is pointing upward.
It has also been fighting potential resistance at its 200-day simple moving average (SMA), but closed above it on Friday.
Speaking of Friday, the fund initially fell below Thursday’s low. It then bounced and cleared the previous session’s high. Is that bullish outside candle a sign of animal spirits?
XLV also had its highest weekly close since early November.
Finally, the 8-day exponential moving average (EMA) has stayed above the 21-day EMA. Such price action may be consistent with a short-term uptrend.
Standardized Performances for the ETF mentioned above:
SPDR Select Sector Health Care ETF (XLV)
1-year: +4.62%
5-years: +48.15%
10-year: +114.50%
(As of January 31, 2025)
Exchange Traded Funds ("ETFs") are subject to management fees and other expenses. Before making investment decisions, investors should carefully read information found in the prospectus or summary prospectus, if available, including investment objectives, risks, charges, and expenses. Click here to find the prospectus.
TradeStation has, for decades, advanced the trading industry, providing access to stocks, options and futures. If you're born to trade, we could be for you. See our Overview for more.
Past performance, whether actual or indicated by historical tests of strategies, is no guarantee of future performance or success. There is a possibility that you may sustain a loss equal to or greater than your entire investment regardless of which asset class you trade (equities, options or futures); therefore, you should not invest or risk money that you cannot afford to lose. Online trading is not suitable for all investors. View the document titled Characteristics and Risks of Standardized Options at www.TradeStation.com . Before trading any asset class, customers must read the relevant risk disclosure statements on www.TradeStation.com . System access and trade placement and execution may be delayed or fail due to market volatility and volume, quote delays, system and software errors, Internet traffic, outages and other factors.
Securities and futures trading is offered to self-directed customers by TradeStation Securities, Inc., a broker-dealer registered with the Securities and Exchange Commission and a futures commission merchant licensed with the Commodity Futures Trading Commission). TradeStation Securities is a member of the Financial Industry Regulatory Authority, the National Futures Association, and a number of exchanges.
TradeStation Securities, Inc. and TradeStation Technologies, Inc. are each wholly owned subsidiaries of TradeStation Group, Inc., both operating, and providing products and services, under the TradeStation brand and trademark. When applying for, or purchasing, accounts, subscriptions, products and services, it is important that you know which company you will be dealing with. Visit www.TradeStation.com for further important information explaining what this means.

$XLV - potential head and shoulderAMEX:XLV it could bounce to $145 but that could also mean a potential right shoulder could form. There are other easier trades. Pass.

XLV Swing Long 1H Conservative CounterTrend TradeConservative CounterTrend Trade
+ long impulse
+ 1/2 correction
+ T2 level
+ biggest volume Sp
- resistance level
Calculated affordable stop limit
1 to2 R/R take profit before 1/2 of the Day
Daily Context
"- short impulse
- unvolumed T1
+ support level
+ volumed Sp"
Monthly Context
"+ long impulse
- SOS level broken
- far below 1/2 correction"
Yearly Context
"+ long impulse
- resistance level"

Park your Funds in HealthCare!
The 2024 performance of health care stocks lagged behind due to investor preference for higher-growth technology sectors. This underperformance has created more favorable valuations, setting the stage for a potentially stronger outlook in 2025. Key drivers for the health care sector include:
1. Innovation
Advances in biotechnology are producing cutting-edge treatments, particularly in specialty drugs.
Leading companies, such as Alnylam Pharmaceuticals and argenx SE, are developing innovative therapies for rare diseases and autoimmune disorders.
Specialty drugs, which account for over half of pharmaceutical sales, are experiencing significant growth.
2. Policy Environment
A possible shift in the U.S. administration could reduce regulatory uncertainty.
Managed-care providers may benefit from Medicare Advantage policy adjustments, fostering a more stable operating environment.
3. Attractive Valuations
After 2024's underperformance, the sector offers lower valuation entry points.
Long-term demographic trends, such as the aging population in the U.S., are expected to sustain growth and demand in health care services and innovations.
Conclusion:
While near-term challenges persist, the combination of groundbreaking innovations, potential policy shifts, and compelling valuations positions the health care sector as an attractive opportunity for investors in 2025 and beyond.

Healthcare Sector (XLV) Long-Term BuyI believe healthcare will be the next rotation coming out of this tech bull run. Using the Trade Jeanie (Jeanius Screener/Indicator), I was able to see the current technical buy signals happening on AMEX:XLV :
Took out an untested low
Price touching 21EMA while the 9EMA > 21EMA
Retested a level that was broken to create a break of structure (BOS & Retest)
The Jeanius Indicator shows green 'Combo' labels every time this same combination of signals happened

Healthcare Sector Poised For A 7% to 15% Rally Into Early 2025My continued research to help traders shows the US Healthcare and Biotech sectors are poised for a very large rally phase into early 2025.
Particularly, XLV and XBI seem uniquely setup to rally more than 9-10% over the next 60 to 90+ days.
This video explains how I use my Adaptive Dynamic Learning Predictive Modeling system to find opportunities other people miss.
Using technology, predictive modeling, and inference engines like this is one advantage I have because I can build any type of technology or system I like - and use it on any symbol or interval I like.
Now is the time to prepare for the big moves headed into 2025. Follow my research if you want to target the biggest price swings in the markets.
Get some.
#trading #research #investing #tradingalgos #tradingsignals #cycles #fibonacci #elliotwave #modelingsystems #stocks #bitcoin #btcusd #cryptos #spy #es #nq #gold

Health Care Sector Is A ShortAnother short setup based on a hidden bearish divergence in the OBV.
We also expect price losses in the Health Care sector in the medium term up to the range shown.

Health Care ETF May Have Broken OutMany observers have spoken recently about market rotation. They often cite money shifting from megacaps to small caps. But another forgotten sector could be benefiting as well: healthcare.
The first pattern on today’s chart of the SPDR Select Sector Health Care ETF is the June 24 close of $147.09. XLV was trapped below this approximate level since late February, but crossed above it earlier in July. Prices are bouncing after retesting it last week. Has old resistance become new support?
Second, you have a series of higher weekly lows since mid-April. Those may reflect accumulation by long-term investors.
Third, prices are near the 50- and 100-day simple moving averages (SMAs). Both SMAs are also near each other, which may create potential for price expansion.
Finally, MACD recently tuned positive.
Standardized Performances for the ETF mentioned above:
SPDR Select Sector Health Care ETF (XLV)
1-year: +9.81%
5-years: +58.70%
10-year: +142.80%
(As of June 28, 2024)
Performance data shown reflects past performance and is no guarantee of future performance. The information provided is not meant to predict or project the performance of a specific investment or investment strategy and current performance may be lower or higher than the performance data shown. Accordingly, this information should not be relied upon when making an investment decision.
TradeStation has, for decades, advanced the trading industry, providing access to stocks, options and futures. See our Overview for more.
Past performance, whether actual or indicated by historical tests of strategies, is no guarantee of future performance or success. There is a possibility that you may sustain a loss equal to or greater than your entire investment regardless of which asset class you trade (equities, options or futures); therefore, you should not invest or risk money that you cannot afford to lose. Online trading is not suitable for all investors. View the document titled Characteristics and Risks of Standardized Options at www.TradeStation.com . Before trading any asset class, customers must read the relevant risk disclosure statements on www.TradeStation.com . System access and trade placement and execution may be delayed or fail due to market volatility and volume, quote delays, system and software errors, Internet traffic, outages and other factors.
Securities and futures trading is offered to self-directed customers by TradeStation Securities, Inc., a broker-dealer registered with the Securities and Exchange Commission and a futures commission merchant licensed with the Commodity Futures Trading Commission). TradeStation Securities is a member of the Financial Industry Regulatory Authority, the National Futures Association, and a number of exchanges.
TradeStation Securities, Inc. and TradeStation Technologies, Inc. are each wholly owned subsidiaries of TradeStation Group, Inc., both operating, and providing products and services, under the TradeStation brand and trademark. When applying for, or purchasing, accounts, subscriptions, products and services, it is important that you know which company you will be dealing with. Visit www.TradeStation.com for further important information explaining what this means.
Exchange Traded Funds ("ETFs") are subject to management fees and other expenses. Before making investment decisions, investors should carefully read information found in the prospectus or summary prospectus, if available, including investment objectives, risks, charges, and expenses. Click here to find the prospectus.

Healthcare sector strongAMEX:XLV had a breakout this week and looks to have successfully retested the breakout and bounced today (July 19, 2024)
Many names in the sector are reporting in the next few weeks and are expected to post good numbers and improved guidance
can see new ATH in the next few weeks IMO
good RR with stop on daily close below 146

XLV is shaping falling wedgeBullish context: weekly uptrend
Price position: near last weekly trend low
Pattern: four consecutive red days with little upthrust (progression of lows)
It looks like previous weekly consolidation area is providing support, and bears are too exhausted to break through it now.
This provides an opportunity for a long play. An example of possible trade is shown on the chart. It is important that today closes above 138.6, otherwise, setup is invalidated
Disclaimer
I don't give trading or investing advice, just sharing my thoughts.

XLV is in tight equilibrium; will break soonAMEX:XLV has formed a five-week equilibrium. The price contraction is already quite tight, indicating that this equilibrium could break very soon. The context is highly bullish: the XLV price is on a weekly uptrend, and the broader market is also showing strong performance. The odds are in favor of an upside breakout.
On the chart, there is an example of a possible trade. Please note that while I’m not a fan of diagonal levels, I’ve drawn the triangle solely to illustrate the idea of equilibrium
Disclaimer
I don't give trading or investing advice, just sharing my thoughts.

XLV Weekly Chart The healthcare sector seems really indecisive if you ask me. Look at all those doji candlesticks. I see why you're not supposed to make moves on these type of candle prints. Especially for someone like me who is a trend trader by nature. We have no choice but to wait and see which way the market wants to move. Up, down, or continue this slight sideways movement. Let me know what you think.

The Healthcare Sector Index $XLV - Worth Watching SPDR Select Sector Fund – Healthcare Index AMEX:XLV
The chart speaks for itself, we have our breakout levels and our break down levels. We enter on a breakout and set a stop 5% under that support and we exit and or short if we fall under the two underside support levels.
Below I outline some reasons why the healthcare sector is worth paying attention too.
The healthcare industry is worth $808 billion in the United States as of 2021. 65% of the industry’s revenue comes from patient care. The global healthcare industry is worth $12 trillion.
In the U.S National health expenditures are projected to grow 5.4 percent, on average, over the course of 2023–31 and to account for roughly 20 percent of the economy by the end of that period. The insured share of the population is anticipated to exceed 92 percent through 2023 (figures pending), in part as a result of record-high Medicaid enrolment, and then decline toward 90 percent as coverage requirements related to the COVID-19 public health emergency expire.
The growth of the health-care sector is evident in employment data as well. In 1990, about 8 million Americans worked in health care; that figure has since doubled to 16 million. That’s the largest single employment segment in our economy.
In addition to the above, the west in general is an aging populace that is living longer. We will need these services more than we need staples during a recession. I believe this index can help us gauge the healthcare sector and what direction it will go next. We can watch the levels outlines and make a play if we wish. We have a hard upper boundary and lower boundary on a parallel channel on the chart. You know what to do when we breach any of these levels.
Outlined on the chart
XLV fund provides exposure to companies in
pharmaceuticals, health care equipment and supplies,
health care providers and services, biotechnology, life
sciences tools and services, and health care
technology industries. XLV is the oldest in the
segment, as such it is used widely for strategic or
tactical positions. Since XLV is both cap weighted
and fishes only from the S&P 500, it tilts heavily
toward mega-caps. For focused exposure to
leading health care names, XLV is tough to beat.
Top Five Holdings
UnitedHealth Group Inc NYSE:UNH 9.63%
Eli Lilly and Co NYSE:LLY 9.19%
Johnson & Johnson NYSE:JNJ 7.46%
Merck & Co NYSE:MRK 5.46%
AbbVie Inc 5.41%
Stay Healthy and Nimble Folks
PUKA

XLV bearHealthCare looks to have just closed the week with a failed breakout.
Getting a weekly close below the impulse breakout green canceled is never a good sign.
technical overbought instrument awaiting pullback

XLV diamond top - remember XLU?AMEX:XLU has long been considered a safe sector for fixed income. Increasing cost of debt and regulatory restrictions on revenue with continued rising rates eventually pushed the largest growth opportunities in the sector out of favor and put downward pressure on the entire sector. Before the market came to appreciate this fundamental shift we can observe a diamond top formation.
Diamond tops are bearish and a break below them experiences an average 20% decline. We can also take potential ranges from the measured height of the pattern and from 50% of the height of the pattern.
We can see a diamond top formation with $XLV. I'm uncertain of what catalysts could pressure the healthcare sector at this time or when we would potentially see them. However, understanding the potential market reaction let's us prepare to protect positions or to capitalize on lows for long term opportunities.

XLV - Failed Breakout?HealthCare looks to have just closed the week with a failed breakout.
Getting a weekly close below the impulse breakout green canceled is never a good sign.
Off of Bearish consolidation some Health care stocks may be a good short play.
Using the up-sloping trend line & weekly 200 MA as support.
Using the Weekly 100 MA as resistance . Recapturing the Weekly 100 MA could result in upside reversal.
