Israel VS Iran War: Oil Spike!Tensions between Israel and Iran have escalated dramatically, with both nations engaging in direct military strikes. Israel launched Operation Rising Lion, targeting Iran’s nuclear infrastructure, missile factories, and military personnel. In response, Iran retaliated with missile attacks on Israel, hitting Tel Aviv and wounding civilians
The conflict stems from long-standing hostilities, particularly over Iran’s nuclear program, which Israel views as an existential threat. The situation has drawn international attention, with the United States distancing itself from Israel’s actions while maintaining strategic interests in the region.
The escalation has raised concerns about a wider regional war, with analysts warning of unintended consequences and further retaliation. The global markets have also reacted, with oil prices surging amid uncertainty.
XOP trade ideas

XOP | SPDR Oil & Gas Exploration ETFHIGH RISK BUY IDEA therefore small-than-average position sizes may apply. The ETF has been sold off aggressively and is currently in an oversold range as well as approaching the prior swing lows. This may be a RANGE to starting building a buy/long position with the expectation that a base can be developed over the near term followed by a potential bullish reversal from the neutral or oversold conditions. Traders can consider starting an accumulation phase at current levels or lower (possibly with a 1/4 of the position and add if/when it trades lower). As always, traders could consider the following if/when the prices approaches the target: bank/take profit, partially scale out, adjust the stop-loss to protect profits. Time stop: 06 October 2025
Trading Levels
Suggested Entry: $119.73 or better/lower
Target: $142.00
Stop-loss: $102.00

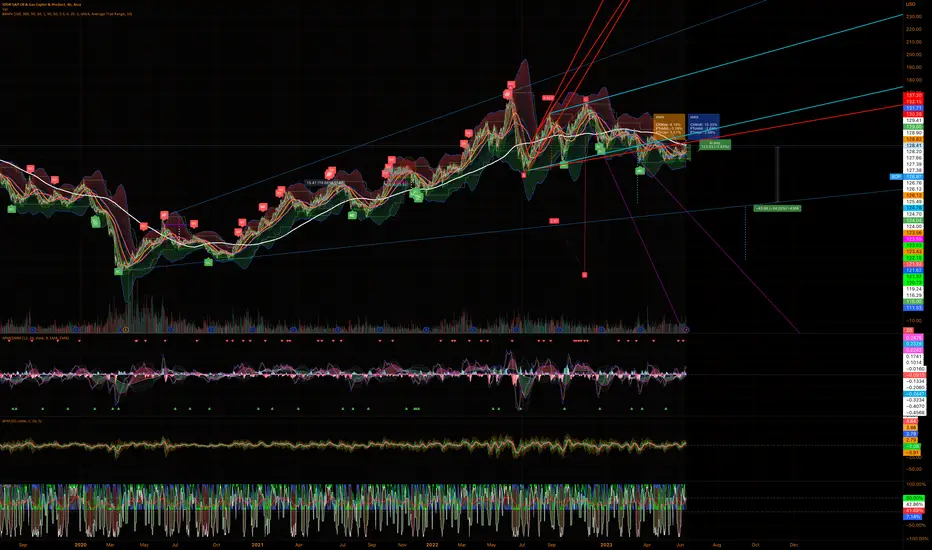
Notice Anything In Correlation Of Elections And Oil?If a Democrat takes office, we are going to see oil continue on its way up. Elliott Wave is guiding the way. I called this out a while ago, and if you have bought since then, you have a better average cost than me.
I am sure everyone will be tuning in to the election. No one knows who will win.
Red Vertical Lines: Republican Wins
Blue Vertical Lines: Democrat Wins

XOP - building base for another up waveThe oil market hasn't been very trendy in the last two years, which is good for building a base for another up wave. XOP is at support right now, a nice place for joining the bull market during a pretty flat correction.

XOP LongUnder the Trump administration, the XOP ETF, which includes companies in oil and gas exploration, did well thanks to policies that boosted U.S. energy production. These included things like cutting regulations, lowering taxes, and encouraging more domestic drilling and exports. These moves helped companies cut costs and invest more in exploration and production. As a result, the sector saw growth. Looking at the technical side, with the ETF now targeting a breakout at the 50% Fibonacci retracement level from March, it's possible that XOP could hit **$182**, a key resistance point, if the positive momentum continues.

Deciphering The Mysteries Within A TrendIn this video, I breakdown trend dynamics to help you understanding what is actually happening in a trend. I cover the following:
What is climatic activity?
What climatic activity means for a trend.
How to spot climatic activity with price action.
How to spot climatic activity with an indicator
How to measure trend strength with price action
How to measure trend strength with an indicator
When trading pullbacks, it is imperative to understand strength of trends. You do not want to enter a pullback at the end of a trend.

XOP Bullish trade of the week not doneOther thaan my Chinese names previously posted, XOP is having an insane week. Seemed like a no brainer considering what is happening in the Middle East. I bought synthetic longs just a few days ago and they are 4X higher today. Bought more synthetic long yeasterday. I would not be surprised if this breaks through risitaance very quickly. So much upside potential.

XOP where is it headed?I'xe held XOP several years. It's a mid-sized oil and gas company, The daily chart looks as if it's at a critical point judging from the DMI/ADX calculation line. We'll see if XOP can stay above 132 today. The world crises becomes more critical each day if anyone looks under the MSM coverage.
I set the VWAP price projections that all point higher and the volume is increasing now, too.
This morning I listened to the Mav of Wall Street mention that 25-50 bp interest rate deduction could create a short cover rally in oil stocks. It looks to be probable in the day chart here.
Anyone can see that from my chart that I'm not a profressionl trader; I simply enjoy challenging my mind and staying involved in geopolitics, etc. The financial market is inclusive of much that interests me in this crazy world. Good luck to all.
I use the indicators used in this chart to guide my decisions using the daily, weekly, and monthly charts whenever all three are pointing bullish. I wonder where oil and gas are headed long term since ENERGY has become a political football IMO.

Trying to find divergences in oil sector .... Trying to find divergences related in the oil sector ....

XOP - Breaking Out 🚀SPDR ETFs are a great way to have exposure to a market without committing to one particular stock.
And here this chart shows the overall market is breaking to the upside in the last few hours.
Notice first the bullish divergence is followed by a shallow descending channel which also appears to be a re-accumulation.
Then a gap up which looks like it will prove to be a "breakaway gap".
And now price is becoming impulsive.
So this looks a great moment to buy this SPDR and have exposure to mostly oil and gas, with a few energy stocks included also.
It could pull back a little but this is with higher time frame perspective and crude oil beginning to look bullish.
And perhaps this is a clue that Natural Gas is nearing a low also.
Not advice.

XOP Bull Put spread testing -1 sigSymbol XOP
Open Date 11/8/2023
Put or Call Put
Expiry Date 12/22/2023
Short Strike 131
Long Strike 130
Price to Open 0.25
Min Width Multiple 2
Risk Ratio 3.00
Return on Risk 33.3%
Opening DTE 44
1 Day ROI% 0.76%
Max Annual ROI % 276.5%
XOP testing the 4h/Daily Bull range.
Held Oct 5 and buyer resumed.
Test again could fail, but could also attract enough activity for the algo to price higher.
IMO especially since there are gaps above in the 141-143 range.
Could need to seek liquidity on those missed orders.
Chose the 131 strike because it's at the -2 sig Bullish level.
I prefer to be behind it maybe 130 or 129, but just couldn't get the sale on the credit.
Did this yesterday morning, and maybe should've waited until the afternoon for 0.03 more, but that's hindsight.
Expiration on the 3 I sold yesterday is gonna be weird as the year closes.
Hopefully no drama that creates a rolling adventure.

Breakout and Backtest = $$$$Breakout and backtest in process...
Oil prices are coming back up soon, watch out.

RSI AND VOLUME FLOW POINT TO DIRECTION SHIFT IN XOPXOP
Using $XOP as representative of the Oil and Gas Exploration Industry.
Pearson's R^2 = 0.95 indicating strong tendency for signal to centralize around its multi-year linear mean (LM, 150.22).
Signal currently resides just above the lower third standard deviation (-3) off the linear mean(LM).
Statistically speaking it would be tough to hold this position for very long and I would expect for signal to either breakdown below the (-3) or mean revert upward toward the LM in the next couple weeks.
In this case a mean reversion up to the LM at 150.22 would be necessary for the current multi-year trend to be maintained at its current trajectory.
Trend breaks down with signal below the -3 (119.06).
Price declining into stronger relative strength and positive volume flow (VFI) can be a sign of the market 'absorbing' price at these levels.
This can be indicative of 'seller exhaustion' and often precedes an 'increased potential' for a directional change in price trend.
(NOT FINANCIAL ADVICE)


XOP for Oil breakout after use of SPR suspendedThe context for this entry is based on the suspended use of our Strategic Petroleum Reserve by the US Government. In April of 2022, our leadership chose to tap the SPR in an attempt to hold off inflation at the pump. While this worked for much of 2022, and early 2023, the SPR can no longer be used or it may compromise our national security (e.g. cut off from external supplies of oil to create fuels in the development of electric and sustainable energy sources).
Since the price of OIL should started to breakout to the upside, we do need to watch inflationary control measures. If they start to dampen inflation, then OIL could remain at the current level for some time. Conversely, if as the Federal Reserve Expects, when inflation only tempers but does not drop into Q3CY23, we should see an increase in the value of OIL.
That's the subjective analysis. The objective analysis based on a decreasing wedge formation on XOP starting April of 2022. XOP continues to bump against a lower low of $110, and most support comes at around $116. Currently it's at $121/123.
The idea is enter put credit spreads 116/117, unless XOP hits $117, then strongly consider 90 day+ call swings. If XOP is at $117, then buy $117 calls for September or October, something 90 days out. The idea between these is that the put spreads limit losses if we retrace to 116, while the call swing is purchased at confirmation of the lower low. Do watch for a breakdown to $110 daily candle wick as seen in other prior days.

Opening (Margin): XOP September 15th 113/148 Short Strangle... for a 2.66 credit.
Comments: Short put for the IRA (See Post Below); short strangle for the margin.
Selling the 16 delta strikes on both sides. 2.66 credit on buying power effect of 12.98; 20.5% ROC at max; 10.3% at 50% max.

xop vs btc🙏Thanks for playing along the "mystery chart" game, some good guesses in there.
💡It was a ratio chart, #XOP versus #Bitcoin!
⚠️Game changing momentum occurring right now in markets, if you are paying attention.
#crudeoil #gold #silver #inflation #fintwit

XOP 2H 2023 3d ChartXOP getting interesting on the back of a possible 2nd half oil push and companies such as Chrevron beating earnings expectations.
See:
USOIL:
Gasoline:

Opening (IRA): XOP September 15th 110 Short Put... for a 1.11 credit.
Comments: Selling premium in one of the exchange-traded funds at the top of my IV screener with a 30-day at 32.2% -- more than twice that of the broad market. (The others are GDXJ, at 35.2%; GDX, 31.2%; and EWZ and FXI, both at 29.1%).
As with my broad market plays, targeting the <16 delta strike in the shortest duration paying around 1% of the strike price in credit.
On a side note: My goals as primarily a premium seller are really simple: put on a given amount of theta/risk premium on a weekly basis, with my preference being for selling premium in (a) broad market exchange-traded funds; (b) sector exchange-traded funds; and (c) single name, in that order. Broad market is kind of sucking a bit here with SPY at 13.6% 30-day IV, QQQ at 20.0%, and IWM at 19.9%, so just looking for a little bit of extra "sumthin' sumthin'" to keep that theta pile on and burning.

Xop no impulse yetxop, might have more room to the downside.
It is not yet showing a 5-wave up.
We might see a retest of wave 4 untill we can call the correction completed.

XOPAction looking good so far this morning. Grabbed some GUSH after hours last night in anticipation of the breakout. Would love to see a big green candle through 22 & 23 YTD VWAPs (purple lines just above).

$83 bearish flag before some bullish activitythere i a bearish flag pointing to $83, we don't have yet, any bull formation, the bull formation is in progress and could e another flag that take us up to $190, but now the bear flag is dominating and strong.
Oil & Gas Sector's Quarterly Log ChartOil & Gas explorers & producers looking VERY CLOSE to MASSIVE breakout. #inflation #oil #gas #silver #platinum #uranium
still consolidating ABOVE 2 year moving average
lots of noise above wall (wicks)
volume defined wall
