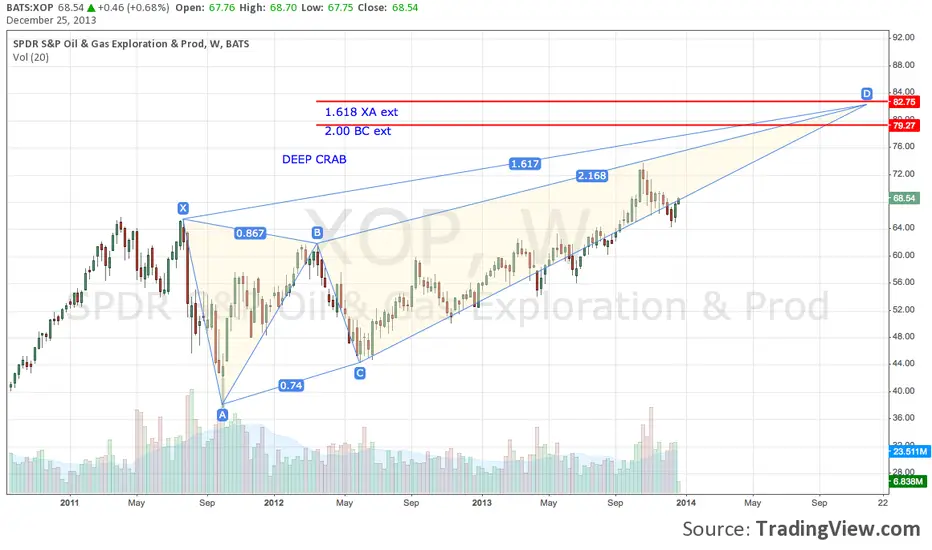
XOP AnalysisLong above $26, which is the 161.8% Fibonacci extension of the October rally
Bullish momentum divergence
Taget of about $32
XOP trade ideas

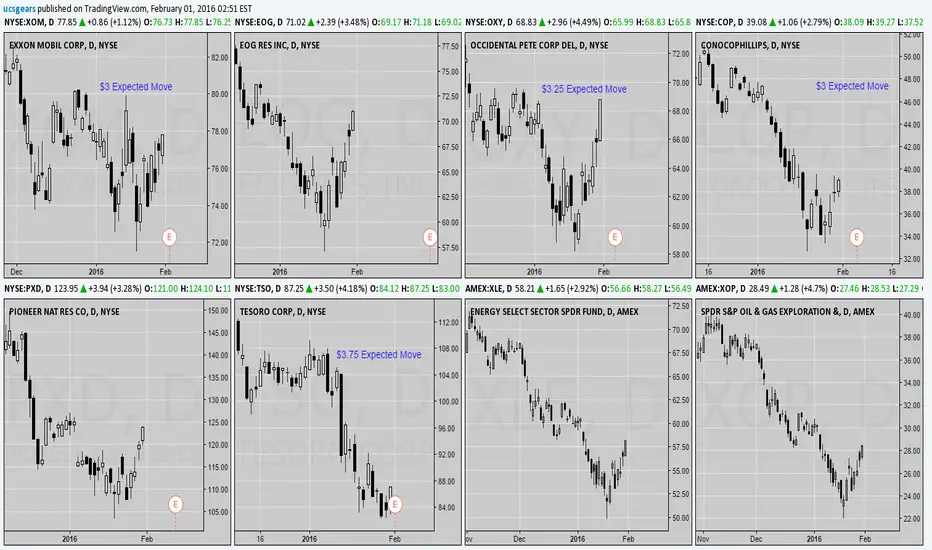
Quick Earning View (Oil & Gas)Oil and Gas stocks this earning has a lot of premium cooked up in the options.
2 x Premium than the expected moves.
Some Companies reported positive earnings and guidelines, while others did not.
Oil Sectors around earnings are a bit tricky to trade. Some people with 10-15 years won't touch these. If you like to take a dip and have fun like me. Go for it.
Warning - Extreme Risk Management Needed
Strategy - Before the earning day, I will add a few butterfly / iron condor (what ever makes the better sense) Could Leg in as well.
After Earning - Close out the worthless side (winning side) and depending on the intraday breakout strategy, will play the remaining to close out for a breakeven or scratch off.
Ideally looking for a zero move. i.e. staying within the range after earnings (highly doubt)

XOP SHORT STRANGLE IDEAWith an implied volatility rank of 76 and an implied volatility of 56, an XOP short strangle is a good premium selling play here, with the standard 45 day setup yielding about 1.00 in credit for only $275 or so worth of buying power.
Here's the setup:
Feb 19th 23/32 short strangle
Probability of Profit: 71%
Max Profit: $97
Buying Power Effect: ~$275
Break Evens: 22.03/32.97
Naturally, things may change come Monday open, so be prepared to tweak your strikes and/or fill price ... .


CNQ Bear Call Spread and XOP Bull Put SpreadI am not sure if this is the right forum for this but anyway... Pairs trading is a statistical arbitrage strategy designed to exploit short-term deviations from a long-run equilibrium pricing relationship between two stocks. This is a well known strategy used by hedge funds and institutional investors. I have previously used pairs trading by trading two correlated stocks. Normally a trader would go long on an underperforming stock and, at the same time, go short on an outperforming stock. If properly constructed this approach eliminates net equity market exposure and the performance is then only depends on the relative performance of the two stocks. As you can see from the above chart CNQ and XOP are correlated and move in a very similar fashion. It is not surprising as they both have very similar drivers - the price of oil and gas. CNQ has recently been outperforming XOP so to construct a pair trade a trader would short CNQ and go long XOP.
For this trade I utilised stock options by selling two January 2016 credit spreads at the same time - CNQ $22/$23 Bear Call Spread for $0.26 and XOP $27/$28 Bull Put Spread for $0.32. The total credit received from these two spreads - $0.58. The maximum risk for the trade is $1.42 per spread and the maximum return is $0.58 per spread (excl. commissions). If the spread between these tow stocks returns to mean, I should be able to profit from the trade. Let's see how this trade performs over the next 4 weeks when the Jan options expire.


SPDR S&P Oil and Gas chart What’s this setting up for ? Is test the support four days and failed, will this expand to the downside, support at $10.90 can this hold? If $USO doesn’t get upside But, SPDR S&P Oil & Gas Exploration & Production $XOP is not so fortunate here but we got Carrizo Oil and Gas $CRZO trying to going revstrat and go back up on the day and then we also got Diamondback Energy, $FANG

SPDR S&P OIL & GAS EXPLORATION.... The birth of a breakout!Hello all,
After a long downtrend you can observe 2 major clues of an impending upward breakout. First the 3 contracting downswings and second the 4 rising bottoms that together have formed a nice Inverted Expanding Pivot ( Or classic Pennant ). The other interesting clues is beginning with the low with have a classic Andrews 5 Pivot count and all the low pivots have failed to reach their respective median lines which are all sign's that the Bulls are building up their positions. I will be stalking this one closely as these moves can be BIG..... Traps are Set!!
PS: Also the last few bars have formed a nice little channel which Andrews used to project the future target by counting the number of touches of the swings.....Conservative 43 and possibly much higher.
Thanks

XOP SPY Dollar EuroThese boxes illustrate where each player is headed, and has to fill, gaps, etc. They are all too aligned not to be filled as a group. Then how do you trade this? Or what can anyone do to stop it each from filling the box? Anyone have a suggestion for that? If oil dips yet again, maybe, but the world knows now the GDP growth ratios are suspect at best. And if there is no more bad news maybe we stay range bound in the boxes for a little while.

XOP and SPX500 hitting major resistance levelsDon't think either one will break through these green rectangle areas. Could remain in these ranges, for a while, so short term back down for both to support (or lower if the OIl bulls get caught long trying to catch that falling knife), or see my triple top theory other chart SPX500.

XOP, swing trade base on MAs and Channel updateHi All,
Apologize for very late update. I was reminded by some to update this.
as the post attached below said, i shorted XOP at 74.5 base on the fact that price was rejected by downslope of 8 and 20 EMA.
Profit target changed slightly to 69
Condition for such trade:
1st: Downtrend channel
2nd. after some upward retracement, price gets rejected by 8 & 20ema
3rd. target is bottom of the red channel

No man's landAfter 2008 top with a H&S formation, price of XOP plunge to channel bottom and consolidate in a multiple bottom before launching an uptrend.
I though i see yet another H&S forming and price tumble in a narrower downtrend channel, again, seems like a ugly consolidation again just above the many supports.
Hence i ask myself, could the multiple mess in 2009 bottom resurface again...

Swing trade based on Moving Average2 days ago, when price was rejected by downslope of 20 EMA, my short position at 74.5 was triggered. Stop loss at 75.4 where there was a minor resistance.
Seems like a variant evening started at 200EMA level but price closed below 200EMA with increasing volume.
Profit target will be 70 which coincide again with the S/R zone between Mar-Apr
This SPDR S&P Oil & Gas ETF is reflected in the movement of stocks like XOM, CVX, etc
And it is a BIG head & shoulder pattern from april until yesterday!


Strong Put to Call open interest ratios Confirmed BEARISHWith Broken the Uptrend and 50 SMA confirmed by High Volume bearish Candle we think this one will goes down especially that we have such Strong Put to Call open interest ratios 9.91 % as we have 376435 Put open Interest against 37999 Call contracts @ DEC 2013 and Nov Option Contracts
