AMPUSD trade ideas

Ampusd buy on decline in to support First decline to green support after strong run up.
Gapping up between candles on 1hr as buying pressures increases
Buy in this areas 0.02140-0.022
If price decline more to green i will look for more buy configuration
As price starts decline in to support i start accumulating amp coins . My average now 0.025 . 155000 amp coins
See idea attached

Amp Breakout PredictionI did some drawing instead of holding my fingers in-front of my eyes and squinting. This is new for me, and I could have gone overboard on the aesthetics, but If I'm right; and AMP follows this very beautiful and geometric pattern; then this whole system makes no sense.... Or does it. I'm not sure. I will start learning the terms and some real indicators for future work... hopefully.

Amp buy 0.02829Amp on daily start decline in to various levels of support- 15ema first, top bolinger next, green band below -as this first decline-expect buyable rebound from this levels
On 1hr gaping up on open and green reversal of red candles
On 15min breaks above resistance band and may become support- buy
If it decline more I will look for more buying configuration

Amp buy 0.03160Decline to support zone on 4hr
On small time frame more greens , engulfing of the bottom bolinger.
Let’s see if price bounce up.

AMPUSD TAfell through the original pitchfork after meeting continued resistance at .038055 and wicking out of the bottom of the second pitchfork but i think its meeting support at .031458 and will bounce back

$AMP DiversionCurrently created ATH followed by Bearish divergence tracking on 4 hr chart shows price struggling but forming a good position for another leg up. Possibly to retest ATH with in the next couple days currently consolidating.
Not financial advise I am not your financial advisor this is my option based on the charts.


AMP/USD upside pausedPrice decreased a little in the last hours after the failure to jump above the SL. It has escaped from the down channel and now tries to approach the downtrend line. Maybe only a valid breakout from the chart pattern will signal a significant rebound and only if the rate will stay within the ascending pitchfork's body (above the lower median line).

Synereo AMP Downside RiskSynereo AMP is clearly trading upwards if looking on the long term picture. Today price reached the uptrend trendline which could potentially be the turning point, where the long-term uptrend could resume.
But, as of yet there is no confirmation that the trendline is rejected and more data is required. Break below the trendline should result in further decline, towards major support at $0.123, that previously acted as the resistance as well as support.
At the same time, if daily close will not get below the uptrend trendline, the wave up could begin sooner than expected. This could result in either a long term uptrend continuation or a strong corrective wave up, towards the upper trendline of the descending channel.

Another promising oneGoing to breakout descending resistance line? Ascending support line, good volume lately, going to burn 33% of coins on March 31st, ... RSI getting to overbought though. To keep an eye on.


one higher high will take us offsimilar to many other coins in the market, synereo is finishing a period of accumulation. the only way from here seems (hopefully) to be up. to break out the red triangle, all we need is a higher high on rsi.

Amp's steady ascentAmp has been slowing been moving up since a low of .09 about a month ago; steadily making higher lows along the way. Looks like on the 9th of November it broke resistance, but the breakout may have been cut short by the btc drama, which started at around that time. The price may very well be suppressed by btc action and undervalued right now. Looking to buy at next test of the bottom support line. In the mean time, since I know nothing about the coin, I'll be doing to some reading up to see if this coin is worth investing for the longer term beyond a short term flip.

Synereo AMP breaks outSynereo AMP breaks out of descending triangle before news of software update. AMP has been in the dumps for a long time with strong sell pressure following a product launch. It reached all time lows, and now it looks like it's recovering. Risk/reward ration is very good, in my opinion. Synereo is a decent start-up company that's still working. If their product, WildSpark, catches on the price could rise substantially. Long term: it may get overtaken by competitors and be relegated to obscurity.

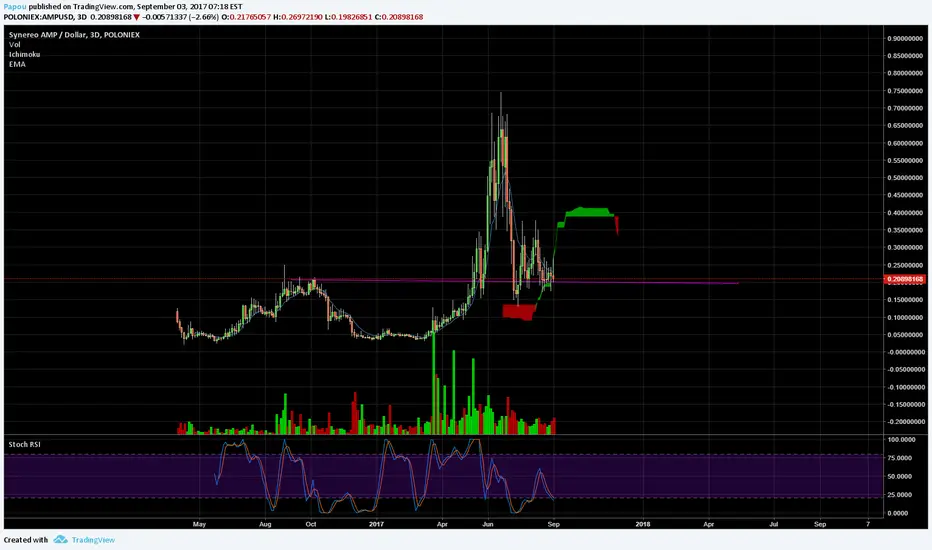
AMPUSD charts are a blessingThis recent addition of USD charts to all coins on polo and bittrex is amazing. They tell us a completely different story than the BTC ones. Despite AMP being a buy on the AMPBTC parity, this AMPUSD shows us something unique most wouldnt have caught without this addition, since it doesnt have a natural USD market. You can see AMP respect its prior bubble top in terms of USD value. Yes BTC has currently out performed it but this is just temporary. Right now would be the clear buy, as we see the market is denying old USD price and turning it into support. Way more volume has entered than exited also note, which both are a great sign of an expansive move to come.