My updated Scalps for AMP accumulation before parabolic runThis is in addition to my thoughts of AMP getting closer to parabolic run. I still believe AMP needs to produce a 9 on the daily TimeFrame from the Demark 9 count before its next parabolic run.
In the meantime I think it has some very pretty scalp targets coming up. It has been playing the wedge and trend lines perfectly. And because AMP does its own thing I have a couple key areas I'm watching to scalp.
AMPUSD trade ideas

AMP up if .051 broken in next few days.If AMP can pass .051 in this next pattern/few days, we can expect a nice run.
Possible fall to .039 and big bounce back. Time to consolidate!

AMP - Now is time to pay attention!Before reading, get rid of your moonboy mentality and no emotions for dips/corrections! Cannot rule bearish scenarios! Dips are for buying!!
People are so focused on the hourly/daily timeframe that they get emotional on every dip! Take a step back to the weekly/monthly timeframe and see why I'm so bullish now. Stop looking at the short term dips/rise. Short term is irrelevant for the move that is coming!
You can't be emotional in these markets (stocks, forex, crypto, real estate, etc.). You will lose this game following the news and doing what the majority does. News creates emotions. Everything you need to know are on the charts. News are manipulated by the elites, and they take advantage of our emotions. Stop listening the news and pay more attention to the charts. Don't follow the majority, because the majority will lose in the end! Also, don't buy the hype when everyone is buying.. instead buy the fear when everyone else is selling
Everything is on the chart! Cryptocurrencies are on the verge of exploding higher. Dips/Corrections are normal and needed in a bull market, and are buying opportunities! Huge gains opportunity in the coming months! Never trade blindly. Use multiple indicators to make calculated decisions. Trade with no emotions!
Facts (Not Financial Advice!):
1. Stochastic RSI - Crossed bullish! Now need to cross the 20 level for bullish continuation!
2. RSI - Broke out through the 6 month resistance trendline! Highly oversold!
3. AMP is one of the few cryptos in the top 100 still lagging and located in the biggest Exchanges in the world! (Coinbase/Binance)
Buy Targets (between the red box! Charted this weeks ago, and already hit my targets!):
Target 1: $0.0458 (Corresponds to the 0.382 Fib Level)
Target 2: $0.042 (Corresponds to the 0.618 Fib Level)
Sell Targets: Shown in chart. Easily can make a $10k investment into $50k in a few months!
"If you can't beat the fear, do it scared!"
"Be fearful when others are greedy, and greedy when others are fearful!" - Warren Buffet.
"Markets are a device for transferring money from the impatient to the patient. - Warren Buffet
"Show me the charts, and I'll tell you the news." - Bernard Baruch
"The secret to investing/trading is figuring out how rich you want to be and how poor you're willing to become."
"If you want to live like the 5% of the population who are hugely successful, then don't act like the 95%!"

Amp token buy 0.04950Decline in to green support band on 1hr after strong run up.
Gapping up on 15 min
Buy 0.04950 to test top bolinger on 1hr
Let’s see

AMP/USD has just stop hunted below the upward trendline!Hello my beauties.
I think AMP/USD is about to fly! Anytime the price has reached below the trendline, a strong uptrend has ensued. Monitor price action, I'm considering buying this pair in case the trendline gets broken to the upside again and the price gives me a successful retest.
If you find this idea to be helpful like, follow, and drop a comment below if you'd want me to analyse a different pair.
Consider supporting me if you think I am providing you with value.
Peace.
Luca, TrickleDownFX

AMP is on fire :)AMP RSI along with technical indicators all pointing the right direction :) Now see where it goes...

Deeper dive into the upcoming AMP break outI always tell people AMP is a slow mover and a great coin to learn how to scalp on. And the more I think about it, the more "slow mover" resonates with me. Also, the more I hear people complain about AMP, the more I realize she's not kind to most buyers.
With that said, I continued to play with My AMP chart and realized while I think her break out is eminent, she might move slow and might not be kind to those that FOMO into her.
I've come to 3 conclusions. She pumps around 10/27, 11/17, or 12/3. Making now a great time to buy AMP if you're ok holding for a bit. AMP is cheap right now.
***Please look at my short term outlook for cheaper entry points.
***At the time of writing this AMP is currently hitting my conservative .0490 scalp call on my short term idea.
Ok... Why do I think 10/27, 11/17, or 12/3? AMP is still in 3 wedges. And those dates are near the end of each wedge.
How will I know when to buy back in?
I noticed that the Demark Indicator flashes a 9 on the 1 Day TF right before going parabolic. I am attaching the chart for your review. BUT I also notice AMP only pumps when it is clearly overbought and rounding up on the Cipher B indicator.
*** If you use this strategy DO NOT buy the 9's if it's not overbought. There is still more room to go down!!!
**** If you did buy, that's ok. Just have diamond hands, because she's going to pump.
*** Pretty art work included in chart about the 9 count on the 1 day TF.
*** I use the "TDS Lite 9" and Vumanchu Cipher B indicators to scalp.
*** I also scalp AMP on the 30M and 8M TFs using the Tom Demark Indicator and cipher B to accumulate. I found those are the most accurate Lower TFs for the 9 count on AMP.
Side note: Make sure you sell AMP at the end of the Pump. You'll have more market capital to buy back in cheaper.

AmpUsd will grow well by breaking the downtrend line and the AmpUsd will grow well by breaking the downtrend line and the

Short Term Outlook for AMP before it's break outThese are my thoughts on the short term targets for AMP. I think it has one more AMP style pump and dump before the break out. Either way this is a great time to buy and hold or scalp AMP.

If history repeats itself AMP is about to pumpI'm seeing very similar buying signs as AMP nears the end of the current wedge it's in.
On the 9HR TF:
Historically:
- When AMP is oversold on the Cipher B indicator and 2 or more 9's start flashing as it rounding the bottom, AMP pumps X2.
- When AMP starts printing higher lows, it pumps X2.
- When AMP does all these things at the end of the wedge it's in, it pumps X2.
All these signs are currently flashing as it nears the end of the wedge it's currently in.

AMP UPDATE.AMP is still on descending channel. It might develop a head and shoulders pattern. The support looks promising to buy.

Don't SellMy 10c target is crystal clear. I was off when I earlier posted that once 6c was taken out, AMP could start moving. But market has its own rhythm and timing. The destination is yet super clear. Added more today.

Buying the dip below 11.8% green fib line last opportunity ??Could this be the last time we see AMP below 11.8% fib line?? It's Possible, if support at 0% fib line is solid, then probability we see upside from here moving forward is high.
-Below I broke down the % of gains for scalpers & if going long, then you have an idea the amount of gains to look forward to at each fib line all the way to 100%.
-As long as price remains above blue solid line, then probability we see upside is high, however, if price breaks down from yellow box & support fails at 0% green fib line, then high probability we see more downside.
The amount of % Gains from 11.8% fib line to:
23.6% fib line = 21% profit
38.2% fib line = 47% profit
50% fib line = 68% profit
61.8% fib line = 88% profit
78.6% fib line= 118% profit
100% fib line = 156% profit
Entry: $0.046
Stop Loss: $0.04425
The amount of % loss from Entry to:
Stop Loss = (3.95%) loss
$0.04213 = (9.2%) loss
$0.0400 = (15%) loss
0% fib line = (21%) loss
-If stop loss triggers, then next support would be $0.04213, then the one after that would be $0.04 (right above 0% fib line)
-If support at 0% fib line fails, then very high probability we see more downside, so be careful & know when to cut losses!
Amp Coin Price & Market Data:
-Amp price today at 7pm est. is $0.04594 with a 24-hour trading volume of $17,983,458. AMP price is up 0.0% in the last 24 hours. It has a circulating supply of 48 Billion AMP coins and a total supply of 99.4 Billion. If you are looking to buy or sell Amp, Coinbase Exchange is currently the most active exchange.
What is Amp?
-Amp is described as the new digital collateral token offering instant, verifiable assurances for any kind of value transfer. Using Amp, networks like Flexa can quickly and irreversibly secure transactions for a wide variety of asset-related use cases.
How does Amp work?
-Amp claims to offer a straightforward but versatile interface for verifiable collateralization through a system of collateral partitions and collateral managers. Where collateral partitions can be designated to collateralize any account, application, or even transaction, and carry balances which are directly verifiable on the Ethereum blockchain, collateral managers are smart contracts that can lock, release, and redirect collateral in these partitions as needed in order to support value transfer activities. Amp supports a wide variety of use cases for collateralization, and also introduces the concept of predefined partition strategies, which can enable special capabilities such as collateral models through which tokens can be staked without ever leaving their original address.

AMP Ready?Not a Financial advisor.
AMP has been taking its sweet sweet time.
At the end of this run amp will be around .17 cents
So much room for this to run with RSI at 44
Should be watching this to run in Elliot Wave Theory
I want to see us break the 50 MA at .0508 then backtest that, then gain some steam will we send this jog into a full sprint. (Impulse followed by wave one) then correction, Wave 3, then wave for correction then wave 5 followed by ABC correction. (If this is Wave theory- which I believe it to be. Especially on higher time)
Won't be updating much on this one here on tradingview will be keeping it for The Swop community.

AMPUSD - SHORTAMP is no doubt a trending coin but is seeing a downtrend and will continue and hit it's initial resistance. What do you think about AMPUSD

Amp token daily and 4hr chartAmp token on 4hr chart hitting top bolinger and breaking below supporting ma , aiming to retest bottom bolinger around 0.042 again.
On daily chart same setup aiming to test bottom bolinger around 0.035
See previous idea attached.

AMP Analysis www.tradingview.com
If BTC continues to 48k or better by Oct. 15th
AMP has potential to go to .064-.074 First Target
Then find support at .056 area
next target would be .094 if break could run
My long term target is .1824
If .046 does not hold support possible breakdown to .029 - .039
Let's go BTC get above 45k and things will be interesting.
Will be looking to exit my position by Oct.15. I expect a major shakeout in BTC but think it will make a decent run possibly to $56k-$59k then dump hard before a new ATH .
Que Insults etc...

Bullish Divergence on the daily with cross on the trend line.Purely education post. Thought I’d share it.
Bullish divergence on the daily chart.
On the forex charts, trades can chart take a me 1 to 2 weeks to play out. Honestly have not tried trading crypto like the forex charts.
You can also see the long shadow on the candle stick that touched resistance and fell. The market continues in the same direction. I imagine that it will retest that long shadow. Could possible be used as a play.
In addition, clean break above the bearish trend line.
No need for feedback, just an idea. Play at your own risk.

AMP on descending channel AMP, currently on descending channel. Price already bounce at the support level. Possibly I will break the the upside.


$AMP starting to turn bullish$AMP has been down in the dumps for weeks now but has slowly started showing some strength. Although today's candle has not closed yet, it has broken its MACD and RSI downtrend lines, respectively.
AMP has been in this strong downtrending channel since July, bounced off the bottom support line multiple times until the 0.04 area held around 9/20/2021.
Today it is starting to break above its equilibrium of the channel around 0.0458 and a close above it would be very bullish. A close above the 21EMA at 0.0479 would be bullish as well, and would put it within reach of the 50EMA around 0.0523. Technically speaking, if it holds the equilibrium it should continue to the top of the channel which would be around the 0.054 area today.


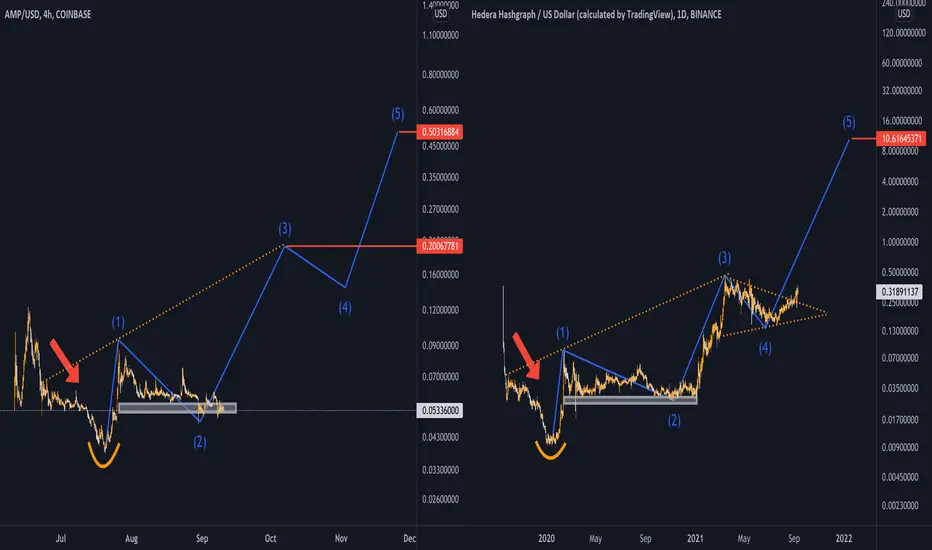
AMPLEFORTH / HEDERA HASHGRAPH FRACTAL!similar structure to Hedera. Wave 3 should start soon
I hope you found the idea interesting:)