Ankr | Chart Structure (Bull-Market Dynamics Explained)Ankr (ANKRBTC) grew more than 2,900% in its 2020/21 bull-market. The bull-run alone (2021) amounted to a strong 1,776% price jump... Amazing.
How are you feeling?
We have a new day, a beautiful day and the Altcoins market continues to heat up.
Let's mention the chart structure for this trade-idea.
Related coins

✳️ Ankr Network Early Call: Three Years Long Falling Wedge + ATHThe falling wedge pattern without a doubt is a bullish reversal pattern.
A breakout from a falling wedge can take its time to play-out which can be appreciated here as the pattern has been going for more than 1,000 days or almost 3 years.
Other than this pattern, what other signals point toward a r

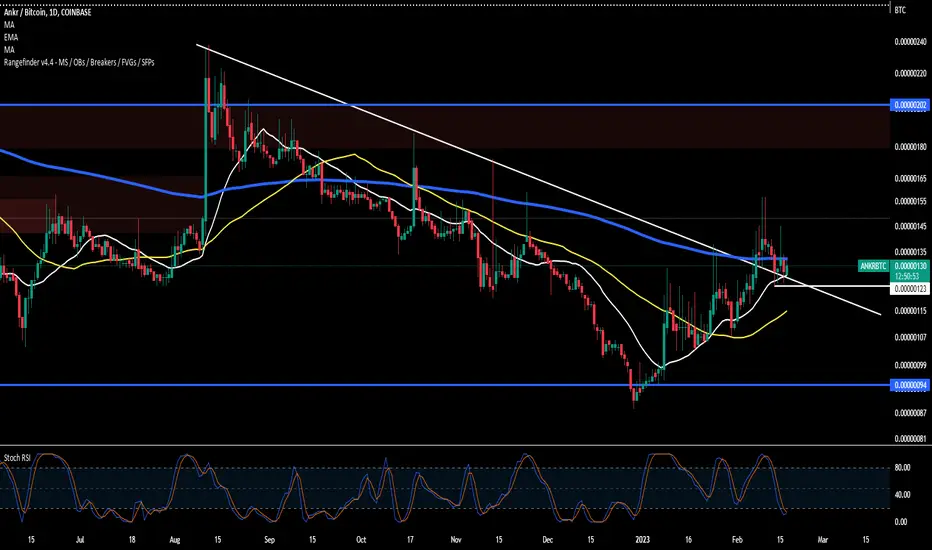
ANKR/BTC - Ankr Network: BBand Breakout Super-Trend◳◱ On the $ANKR/ CRYPTOCAP:BTC chart, the Bband Breakout Super-Trend pattern suggests an upcoming trend shift. Traders might observe resistance around 0.00000096 | 0.00000108 | 0.00000135 and support near 0.00000069 | 0.00000054 | 0.00000027. Entering trades at 0.00000091 could be strategic, aiming

$ankrlonged this bubba on this dip
no sign of strength yet on usd pair below 200 ema after attempting to reclaim it
who knows may just close above tonite
either way btc pair gives a good indication of where we are at and this has no good thing going for it yet but the stoch looks to be bottoming out

✳️ Many Options, Trading, Opportunities, ALTSBTC & More | 150%+Many options, many opportunities.
The good, great, positive, nice or very awesome part is that these pairs, Altcoins vs Bitcoin, are breaking out in huge candles. I am seeing a 30% to 50% jump on the initial breakout which tells us that this bullish wave will be really strong, it should go for week

#ANKR/BTC - Long - Potential 21.01%Style: SWING
Direction: LONG
Market: SPOT
Risk: 0.25% - 1%
EXCHANGE: BINANCE
#BTC_ANKR
TIMEFRAME: 720
ENTRY: 0.00000137
⎿ TP2: 0.00000167
⎿ TP1: 0.00000152
STOP: 0.00000122
Late publishing but still viable. Classic volume trend breakout. 100% at TP1 though as with thin volume over th

#ANKRBTC - 15 to 20% Drop Closing InComing off the back of a recent very profitable Long trade it appears we're bouncing off resistance and a historical level of SR to the downside once again.
We'd expect somewhere between 15-20% on this Short before taking profits at the next support level on the underside.
If you enjoyed or agree

$ankr looks tempting as long as we hold today's low looks to be headed up to blue line or range high
nice r/r
daily stoch crossing flip 200 ema retest it the break range high imo
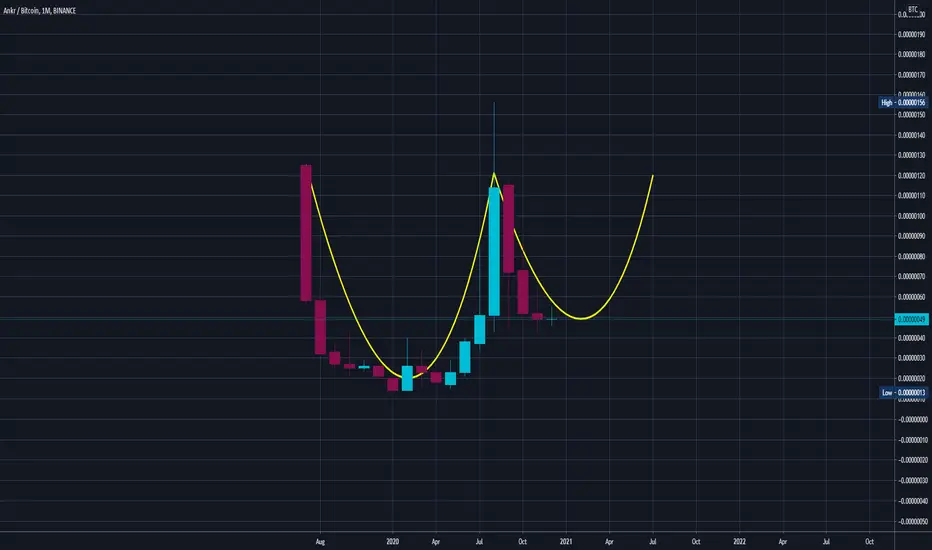
ANKR- Inverted Hammer Candlestick Pattern (to be valided)
- Potential monthly cup & handle in formation (to be valided)

See all ideas
Summarizing what the indicators are suggesting.
Oscillators
Neutral
SellBuy
Strong sellStrong buy
Strong sellSellNeutralBuyStrong buy
Oscillators
Neutral
SellBuy
Strong sellStrong buy
Strong sellSellNeutralBuyStrong buy
Summary
Neutral
SellBuy
Strong sellStrong buy
Strong sellSellNeutralBuyStrong buy
Summary
Neutral
SellBuy
Strong sellStrong buy
Strong sellSellNeutralBuyStrong buy
Summary
Neutral
SellBuy
Strong sellStrong buy
Strong sellSellNeutralBuyStrong buy
Moving Averages
Neutral
SellBuy
Strong sellStrong buy
Strong sellSellNeutralBuyStrong buy
Moving Averages
Neutral
SellBuy
Strong sellStrong buy
Strong sellSellNeutralBuyStrong buy
Displays a symbol's price movements over previous years to identify recurring trends.