ANKRUSDT trade ideas

Going long #ANKRANKR continues to pump nonstop over the past few weeks, and continues to form higher lows.
1) ANKR is above the 50W SMA
2) ANKR is above the 8W SMA
3) ANKR is above the Ichimoku Cloud
4) ANKR retested and bounced off the RSI Support.
5) ANKR/BTC is bullish and continues to outperform BTC as BTC dips.

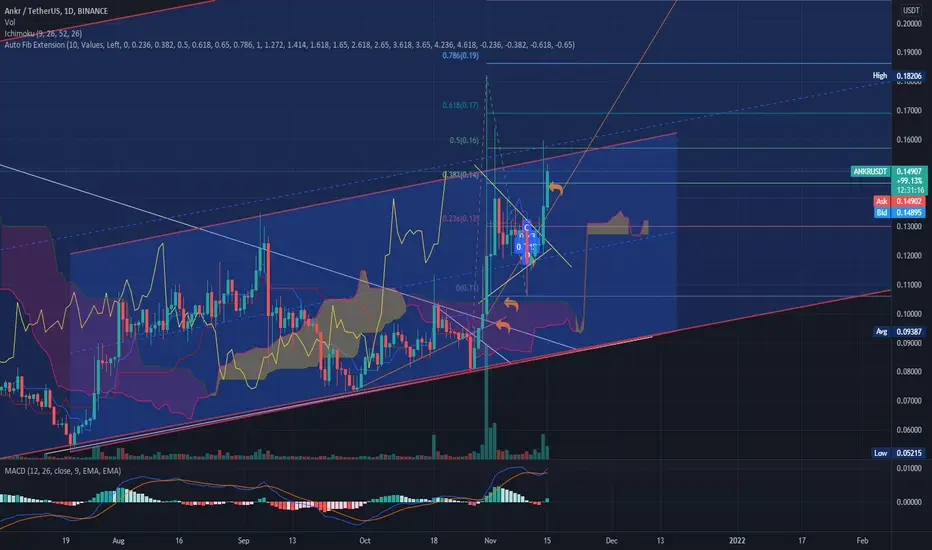
we can expect ANKR usdt 0,15 0.18 soonANKR usdt has broken symmetrical triangle now it may go 0.15 -----0.18

ANKR LOOKS soooo bullish + TPs (Pennant break)I will enter after break+retest, i will keep idea updated. RSI and RSI stochastic looks very bullish. Tps on chart, move SL into profit after 1st TP hit. Good luck traders.
TPS
0,15
0,175
0,22
0,248


ANKR near to break out triangle#ANKRUSDT
$ANKR had 86% increase and touched all targets of last analysis ✅
now price is inside a triangle pattern that if break out from this pattern price can have another leg up to $0.17 and $0.21.
break down from lower line of triangle can drop price to descending support around $0.087.


ANKR GOING FOR BREAKOUT BUT AT 0.13 OR 0.131ANKR/USDT going for breakout you can take entery to for the huge profit targets are 0.18-0.20


ankrusdtit's time for ankr to goes a bit higher, all the bullish conditions are meet. all the targets are mentioned in the chart.

ANKR/USDT 4HOUR UPDATEWelcome to this quick ANKR/USDT analysis.
I have tried my best to bring the best possible outcome me in this chart.
Reason of trade :- ANKR/USDT is bullish trend conform retest buy the dip and green zone
Entry:- buy green zone
Traget:- 20% to 30%
Stoploss:-100 moving average downside candle close
Remember:-This is not a piece of financial advice. All investment made by me is under my own risk and I am held responsible for my own profit and losses. So, do your own research before investing in this trade.
Happy trading.
Sorry for my English it is not my native languages
Do hit the like button if you like it and share your charts in the comments section.
Thank you...

$Ankrusdt classic longBuy: current price
T1: 0.21678
T2: 0.34027
Stop-loss: 4h. below 0.1
Ref: stockaholic

its time to buy and Hodl some pumping soon , we will se the VOL is start increasing and then alt season will start .

ANKR potential...ANKR trending up and it can skyrocket from here if the line gets hit there are various tp levels for both short and long term traders. hope I can help you ;)

ANKRUSDT Technical Analysis⏳ Spot
💎 ANKRUSDT has formed asymmetrical triangle. The price has got rejected from the support line several times, it might go to the support line one more time before breaking above the triangle. After the breakout we can expect a bullish move
🌐 Tradingview
💵 Invest Only 5% of your Portfolio
🎳 Entry/Pullback now or from 0.13328 to 0.11667
☕️ TP1 0.15255
🍺 TP2 0.18458
🍻 TP3 0.21839
🍾 TP4 0.25000
🍷 TP5
🍸 TP6
🍹 TP7
🎁 TP8
🚫 SL 0.11667 to 0.09651
Good Luck 🎲
Check the Links in Description and if you LIKE this analysis, please support our page and Ideas by hitting the LIKE 👍 button. ❤️ Your Support is really appreciated! ❤️
Traders, if you have your own opinion about it, please write your own in the comment box. We will be glad for this.
Feel free to request any pair/instrument analysis or ask any questions in the comment section below.
We will have more FREE forecasts in TradingView soon
Have a profitable day 😊👍🏻

ANKRUSDT - LONG SETUPANKR looks strong despite the market decline. price broke out above a large cup and handle on the daily timeframe and currently made a nice correction to retest previous resistance as new support in confluence with the 0.618 fibonacci. On the 4hr timeframe if price closes back above this horizontal resistance and back above the EMA's we will open leverage long on the retest of this zone. Remember we have to first see a 4HR CLOSE above this zone to validate this setup.

ANKR chart pattern and indicators seems greenANKR chart pattern and indicators seems green its under watching from 0.09
daily triangle broke 15 days ago it seems can touch
0.155 - 0.172 - 0.186 - 0.202 - 0.220- 0.25
long term target can beat 0.7$ KUCOIN:ANKRUSDT

ANKRUSDT - Elliott wave roadmap to $4wave 3 of (3) completed at the fibo 1,618, and the triangle in the wave (4) also may be completed.
Likely we will get the continuation of the trend of daily frame.

ankrusdtankrusdt
history will repeat in ankr
its make 1500% two times and I think we will have another 1500%

Free CRYPTO Signal: ANKRUSDT long it!Ankr looks bullish and according to my strategy I am opening this trade.
ENJOY FREE MONEY!

ANKR/USDT { ANKR } - BULLISH SETUPANALYSIS 🔎
- ANKR/USDT brokeout above the symmetrical triangle's inclined resistance as expected from my previous analysis.
- The market hit a swing high.
- It's currently undergoing retracement.
- Price is testing the symmetrical triangle's inclined resistance + horizontal support level + key fibonacci retracement zone (0.618 - 0.702 - 0.786).
- This is your buy zone.
BUY ENTRY ⬆️
- Current market price.
TARGETS 🎯
- Horizontal resistance level (@0.16400).
- Horizontal resistance level (@0.18206).
- Horizontal resistance level (@0.21662).
SETUP INVALIDATION ❌
- Breakdown below the 0.786 fibonacci retracement level.
