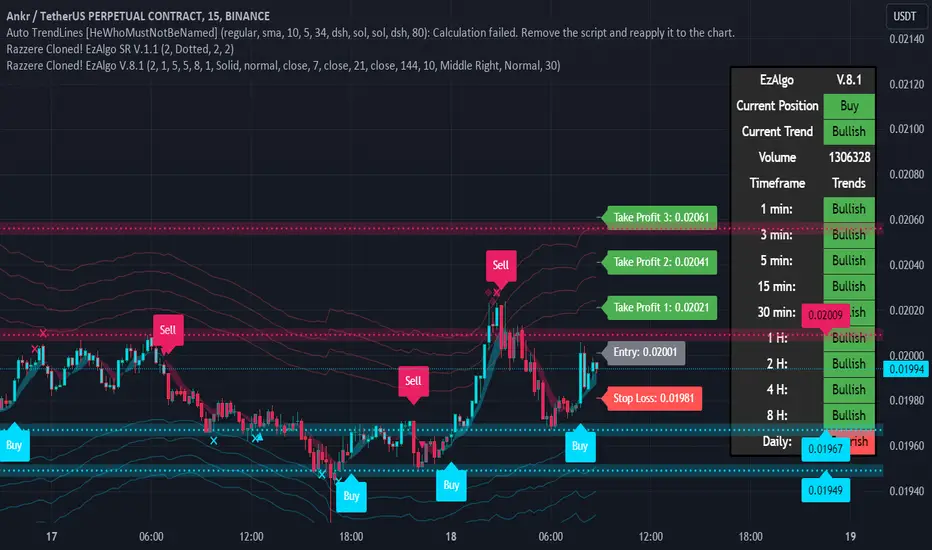
ANKR ready for take offANKR is bullish. I think it will break the resistance and go to tp3 easily.
Entry: 0.02001
Tp1: 0.02021
Tp2: 0.2041
Tp3: 0.2061
Stop Loss: 0.01981
Please follow me more signals.
ANKRUSDT trade ideas
Short Position Plan with Trend AnalysisMEXC:ANKRUSDT.P
Use the break-retest of the last local support channel for opening short position.
Good Luck Everyoneç

ANKR SHORT TIME LONG POSITIONHello dear traders
In ANNR currency, we can have short-term long positions in 30 and 15 minutes time frame.
1.5 risk to reward can be suitable for this signal.
I hope you make the most of these signals
Thank you for your support

ANKR Is Ready To Give Us A Bearish WaveWelcome to our crypto exploration hub! We're here to navigate the exciting world of digital assets, providing you with comprehensive insights into market dynamics and potential trading opportunities.Our mission is to decode the crypto market's mysteries and equip you with the knowledge you need to make informed investment choices. From the latest developments in Bitcoin to the hidden potential of various altcoins, we're your trusted source for daily technical analysis.While technical analysis is a valuable tool, it's important to remember that it's just one piece of the puzzle. We encourage you to take a well-rounded approach to your investments, considering factors like macroeconomic trends, news, and community sentiment.Join us for the freshest analyses, and don't hesitate to join the conversation in the comments below. Keep in mind that our content is purely for educational purposes and should not be construed as financial advice. Always integrate it into your broader investment strategy."

ANKRUSDT.PAm positive on a sell off from 0.02033 to 0.01940 on this pair, seeing that after it went for a buy-side liquidity it instantly broke its most recent structure on the H4 tf whilst taking out a sell-side liquidity too and it’s currently selling after mitigating my orderblock.

ANKRUSDT Inverse Head And Shoulder!ANKRUSDT Technical analysis update
Buy zone : Below $0.0206
Stop loss : $0.0197
Take Profit 1 : $0.0214
Take Profit 2 : $0.0228
Take Profit 3 : $0.0246
Take Profit 4 : $0.0275
Always Keep Stoploss
Thanks
Hexa


0.02002-0.02122: Short-term uptrend beginsHello?
Hello traders!
If you "Follow" us, you can always get new information quickly.
Please also click “Boost”.
Have a good day.
-------------------------------------
(ANKRUSDT chart)
(1M charts)
The key is whether it can rise above 0.02761.
(1W chart)
You can see how important the current price position, that is, around 0.01915, is the support and resistance zone.
However, even if the price rises, there is a huge resistance area, so it appears that it will take time for it to be seen as a significant rise.
The key is whether it can receive support within the box section at the current position and rise above 0.02885.
If not, it may fall to around 0.01092, so you need to think about a countermeasure.
(1D chart)
The support and resistance zones formed at the current price position are
- 0.001636
- 0.03776-0.04771
Same as above.
Therefore, the key is whether it can receive support in the 0.01814-0.01901 range or higher and rise above 0.02122.
If not, there is a possibility that it may fall below 0.01575, so a countermeasure is needed.
If it shows support around 0.01901 this time, it is expected to turn into a short-term upward trend.
However, it is expected that there will be another support and resistance test by rising above 0.02122.
When the test is over and the rise begins,
1st: 0.02680-0.02776
2nd: 0.03776
It is expected to rise to around the 1st and 2nd levels above.
-------------------------------------------------- -------------------------------------------
** All explanations are for reference only and do not guarantee profit or loss in investment.
** Trading volume is displayed as a candle body based on 10EMA.
How to display (in order from darkest to darkest)
More than 3 times the trading volume of 10EMA > 2.5 times > 2.0 times > 1.25 times > Trading volume below 10EMA
** Even if you know other people’s know-how, it takes a considerable amount of time to make it your own.
** This chart was created using my know-how.
---------------------------------

ANKR Possible Playout ChartThe price movement for ANKR is predicted to increase because it is now in the ID support area. September 25th can be a determinant of whether ANKR will experience a decline or increase, but at the price of $0.01935 it has several supports of 5x retest support and resistance so this price is the key price for the next movement. The potential increase for ANKR is 6.53% in the next 1 week. To confirm bearishness, ANKR needs to close the candlestick below the price of $0.01879.


ANKR 2x-5x LONGANKR 2x-5x LONG
INVERSE Head & Shoulders
Not Financial Advice
This is for Entertainment Only

#ANKR/USDT is testing the Diagonal Trendline in 4-Hour TF!#ANKR/USDT is testing the Diagonal Trendline in 4-Hour TF!
$ANKR needs to clear the Diagonal Trendline to gain bullish momentum. Wait for BO/retest to open a long position.

Our attempt to identify the next "pump coin". ANKR long trade #8While the previous few days, the most voluminous and liquidity cryptocurrencies have been falling in value, some coins have been pumping like as: FLM, GTC, PERP, UNFI, Cyber etc...
This trade is our attempt to determine which coin will be the next to "pumping". That is why we halve our standard entry amount to $5000 and emphasize that a stop order is required.
Enter = 0,01841
Stop = 0,01797 ( -2.4%)
TP = 0,02394 ( +30%)
P/L ratio = 12.6
According to these conditions, with a position size of $5000, the amount of potential loss is $120, and potential profit is $1500.
What do you think, "Is this game worth the candle"? Write your thoughts in the comments

Ankr Small Sell TradeHere is My Study On ANKR.
Welcome to my channel! Here you'll find daily technical analysis ofthe latest trends in the crypto market. From Bitcoin to altcoins, I'lIl be sharing my insights and predictions to help you make informed decisions
about your investments. Follow me for the latest updates and join the conversation in the comments!
Crypto technical analysis uses past price history to predict future price. It's not a guarantee and shouldn't be relied on solely for investment decisions. Consider other factors such as market trends, economic strength and
information dissemination. Use with caution.
This Is Not A Finacial Advise

ANKR next 🐻 move Looking danger ⚡ to me 🐱
The trend line even act as parabolic curve 🪝
2.½ yr support target 📌 expecting 35-65% crash easily on COINBASE:ANKRUSD
if u have any idea 💡 comment below

bullishHello friends
The orange zone is the range obtained by ICT style
signal is spot
SL never forget

ankrusdtIt is possible that a five-way decline will be implemented in order to complete the C-wave and end the historical drop in the currency, so let's see what will happen

ANKR/USDTshort term targets are the two blue lines
take profit target 1
take profit target 2
long term target is the resistance of the upper white line

ANKR/USDT upward momentum!!👀🚀Ankr Today Analysis
💎Ankrusdt is making intriguing moves as it neatly follows the overlapping trajectory to reach the bearish Order Block (OB) to tap into additional liquidity.
💎 In the past, it experienced a significant downward shift as the demand turned into supply, further reinforcing the downward movement.
💎 After tapping into the downward liquidity, it set an upward momentum, tapped the OB once, faced rejection, and is now setting up again for upward momentum to tap into the remaining liquidity.
💎 In the dynamic world of crypto, staying informed and adaptable is key. Stay tuned for more updates and enjoy your trading journey

Brief Analysis ——ANKRToday we will share a brief analysis of 3 old-school tokens. They are ANKR, IOTA and LINA.
After the dump in early June, ANKR completed a V-reversal. The price quickly returned to its original position. After that, the bears frequently strengthened, but the price remained within the black angle, and each low is higher than the previous one. This is a bullish signal. The price has exceeded the lower rail of the angle this week, but it has not been confirmed. It may return back in the angle. From the perspective of bulls and bears, the bulls failed to stand on the upper rail of the angle many times and the bears strengthened on Sunday, suppressing the bulls.
Conclusion: Mostly falling. ANKR maintained neutral on a large scale, but it has turned bearish on a small side. We think a downside is more likely. In any case, once the price confirms its direction and breaks through the black angle, then the short-term trend is formed. We set resistance level at 0.029 and support level at 0.019.
If you have any ideas, welcome to communicate with us:)
Disclaimer: Nothing in the script constitutes investment advice. The script objectively expounded the market situation and should not be construed as an offer to sell or an invitation to buy any cryptocurrencies.
Any decisions made based on the information contained in the script are your sole responsibility. Any investments made or to be made shall be with your independent analyses based on your financial situation and objectives.

ANKR LOOKS BULLISH (6H)Hi, dear traders. how are you ? Today we have a viewpoint to BUY/LONG the ANKR symbol.
For risk management, please don't forget stop loss and capital management
When we reach the first target, save some profit and then change the stop to entry
Comment if you have any questions
Thank You


