TradeCityPro | APE: Key Breakout Watch in Gaming Token’s Range👋 Welcome to TradeCity Pro!
In this analysis, we’re taking a look at the APE coin — one of the prominent American gaming and metaverse projects that gained major traction during the last bull run.
⭐ Currently, APE holds a market cap of $540 million and ranks 110th on CoinMarketCap.
📅 Daily Timeframe
As shown on the daily chart, price has reached a key resistance zone and has tested it several times.
✔️ If this resistance breaks, it could confirm a trend reversal, potentially opening the way toward higher levels like 0.8990 and even 1.973.
🛒 For spot buying, an entry can be considered upon the breakout of this resistance, though it's safer to wait for confirmation of bearish momentum in Bitcoin dominance before entering a spot position on APE.
📈 However, for futures positions, this same breakout trigger can be used — either on the daily chart or lower timeframes.
🔽 On the short side, a support level has formed at 0.6073. A break below this could extend the bearish trend toward 0.3833.
⚡️ Still, there’s a major support level nearby at 0.5633. If you’re looking for a more conservative short entry, you might wait for a clean break below 0.5633.
💥 Momentum confirmation for the short position would come with an RSI breakdown below 46.46, which would signal stronger bearish pressure entering the market.
📝 Final Thoughts
This analysis reflects our opinions and is not financial advice.
Share your thoughts in the comments, and don’t forget to share this analysis with your friends! ❤️
APEUSDT trade ideas

APEUSDT: Trend in daily timeframeThe color levels are very accurate levels of support and resistance in different time frames, and we have to wait for their reaction in these areas.
So, Please pay special attention to the very accurate trend, colored levels, and you must know that SETUP is very sensitive.
Be careful
BEST
MT

ApeCoin Quick Update —Moving NextWe looked at ApeCoin recently and I was certain this pair was set to move forward... What happened? Nothing really. Look at the action the last five days. The three red days were a nothing, just a small retrace and sideways consolidation. Now we are full green again.
I mentioned how the top performers will change now in this newly developing bullish continuation, there is more. The first wave peaked after 100 and 300% profits, the second wave will be between 200 and 500% profits for each pair on average. Awesome isn't it?
» Then there will be even more so this is only the start.
This is a timing based publication. APEUSDT is set (likely) to move next.
Note. Remember, it can always take longer than expected but the bigger picture doesn't change. It is going up. Buy and hold. The market takes care of the rest.
Namaste.

ApeCoin (APE) Forming a Bullish Reversal?📈 Key Levels to Watch (Daily + 4H Technical Analysis)
On the daily timeframe, ApeCoin (APE) is forming a clear inverse head and shoulders pattern near the bottom of the chart — a classic bullish reversal signal. A confirmed breakout above the $0.7106 resistance level could mark the beginning of a new uptrend.
Currently, APE is trading within a consolidation box, offering potential for both breakout and breakdown plays:
⚠️ A break below $0.5950 may open up a short opportunity,
But due to the lack of a strong bearish trend, quick profit-taking on shorts is strongly recommended.
---
📉 4H Chart Insights:
Downward moves are occurring on declining volume, while upward pushes toward $0.7106 are happening with increased volume, suggesting that bulls have more conviction than bears.
If RSI breaks above 80 on the 4H chart, it could serve as a secondary confirmation of renewed bullish momentum.
---
💡 Trading Strategy:
This zone is attractive for both spot entries and futures setups:
For futures, a dynamic stop-loss can be placed around $0.6722, subject to market volatility.
For spot traders, a more conservative stop-loss would be around $0.5891.

ApeCoin (APE) Cup Pattern (1D)After a deviation below demand, BINANCE:APEUSDT formed a clean rounded bottom, reclaimed the zone, briefly consolidated, and it's now attempting to break above resistance.
Key Levels
• $0.79: Current resistance
• ~$0.65: Current support, breaking it might lead to the formation of a handle
• $0.50-$0.60: Main demand zone and logical pullback target in case of a handle
• $1.20: Measured breakout target, and previous swing high
Worth watching it closely for a daily close above $0.79 with good volume to activate the target.
Alternatively, look at the $0.50-$0.60 area for a reversal in case of a rejection here.

APEUSDT 1D AnalysisAPE ~ 1D Analysis
#APE This trade is very risky
Buy after successfully breaking this resistance line with strong volume. With a short-term target of at least 15%+.
APE/USDT"APE coin could potentially reach the current resistance level first, and then move toward the next targets. Let me know what you think!"

#APEAped in small size position here based off gut feeling, only 1% risk atm will add up once we have follow through

ApeCoin 369% Target Explained —Altcoins 2025 Bull MarketThis is an interesting pair. The entire Altcoins market is waking up now and gaining in bullish momentum. I just want to show you the target.
From the April bottom to present day, Apecoin has grown by ~100%, which is nice, solid, but there is great potential for additional growth.
The second target at 369% from current price, at the time of writing, would yield more than 840% from the April bottom. So if this isn't the 2025 all-time high, which I believe won't be, then the total growth potential for this bullish cycle is astonishing. It will be huge.
So far we continue to see and experience slow and steady growth, but soon, the Altcoins market will produce amazing growth. It will be something to experience, it is good now to buy and to hold LONG.
Namaste.

#APEUSDT Analysis — Testing Bottom of the Channel📉 #APEUSDT Analysis — Testing Bottom of the Channel
🗓 Published: April 23, 2025
🕰 Timeframe: 1W | 📊 Exchange: Binance
🔍 Technical Overview
APE is currently sitting near the lower boundary of a descending channel that has been in play since mid-2023. Historically, this zone has offered short-term bounce opportunities when tested.
📌 Structure:
✅ Long-term Falling Channel
✅ Testing lower support line
✅ Previous bounces from this area led to 2x–3x moves
🔻 Panic Level (Invalidation Zone)
📉 $0.2793
A weekly close below this level would invalidate the current bounce scenario and could lead to a sharp capitulation phase.
🎯 Upside Targets (If Bounce Confirmed):
Resistance 1: $0.8688 — First major horizontal level
Resistance 2: $1.6642 — Upper channel resistance zone
📈 If market conditions support it, this bounce could extend toward the channel top for a potential +200% gain.
🧠 Strategy Insight
APE is deeply oversold on higher timeframes and testing historical low levels within a well-defined downtrend channel.
🔎 Early buyers may look to scalp the bounce, but safer entries require confirmation above $0.60–$0.70 zone.
💡 Play this as a bounce trade, not a breakout — unless price reclaims $1+ with volume.
🗣 What’s Next?
Watch for weekly confirmation candles. If we get bullish divergence or reclaim MA resistance, APE could be one of the top rebounders this cycle.
📢 Oversold. Unloved. But technically primed. APE might surprise again.
Please keep in mind that this is not financial advice and the purpose of these charts is to provide an idea of coin movement, not buy or sell signals. The cryptocurrency market is highly volatile and not suitable for everyone, so be aware of the potential risks before making any investment decisions. The information presented here is a personal effort and is subject to success or failure, and we welcome constructive criticism.
Good luck to all.
🙏we ask Allah reconcile and repay🙏

APEUSDT: Approaching Key Resistance in Descending ChannelThe asset continues to trade within a broad descending channel. Currently, the price is approaching the upper boundary, sitting near the channel’s median line — a key level that often acts as support or resistance.
Locally, a potential bullish flag pattern is forming, pointing toward the resistance zone. A breakout above this channel boundary could trigger a trend reversal to the upside.
Long targets are marked on the chart. Keep in mind the alternative scenario: a rejection at resistance and a possible return to the channel’s lower boundary remain valid.
Always practice proper risk management
The asset is traded on multiple liquid exchanges, including Coinbase, which adds optimism to its potential outlook.

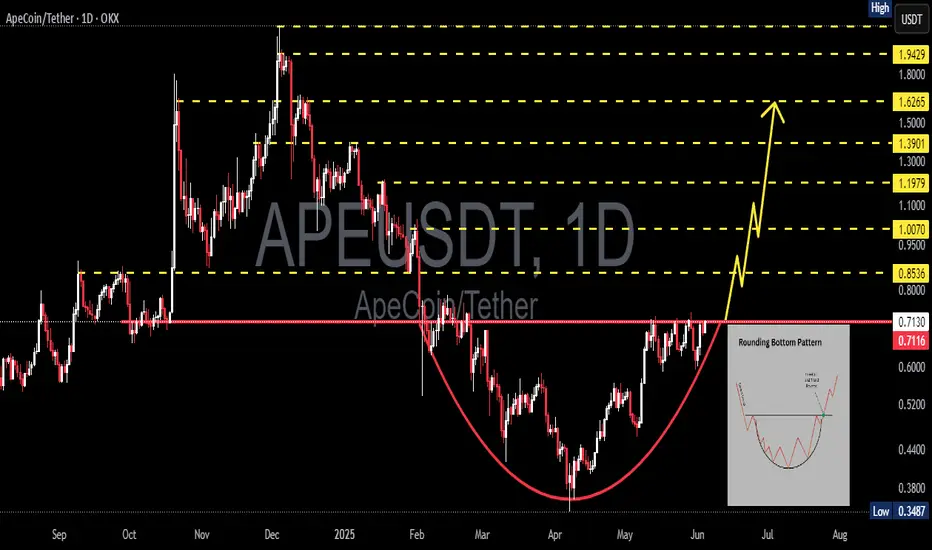
APEUSDT 1D#APE has broken the descending resistance to the upside and has formed a Rounding Bottom pattern on the daily chart. Consider buying it near the support and the daily EMA50. In case of a breakout above the neckline, the targets are:
🎯 $0.8577
🎯 $0.9779
🎯 $1.1490
🎯 $1.3670
⚠️ Use a tight stop-loss.

Buy apeusdtPrice is previously bullish, retested a major support zone and formed an inverse head and shoulders pattern with a break and a retest of the neckline.

ApeCoin Uptrend Points To 438% Mid-Term TargetThe black lines are the bottom lines. The action below the lower black line is the actual bottom. ApeCoin (APEUSDT) trading above the higher black line is 100% bullish zone bullish confirmed. You see on the chart the development of an uptrend, it is already underway.
Orange = downtrend. 5 months. December through April.
Right side = uptrend. ~8 months. April through late 2025.
The duration of the uptrend can vary of course, can be much longer or shorter. What we can know for sure is that market conditions have changed. We are 100% bullish now. Cryptocurrency is bullish now. The Altcoins are bullish now. ApeCoin has been growing for more than a month.
» Easy target on the chart 438% with more long-term. This one can hit within 1-3 months (mid-term).
Thank you for reading.
Namaste.

APE on monthly chartBINANCE:APEUSDT
On the monthly frame, we have a bounce from the lowest point the price reached with a strong positive divergence, which indicates a significant reversal is coming.
Surpassing the areas of $2.1 and $2.6 will be the key to a strong price increase.
It will be updated in the event of any new developments.
waiting ..

APE.USD mission accomplished Got in at .42 once range was reclaimed. Ran it from the lower deviation to the top one, just beautiful. External fib expansion provided the structure while horizontal gave the supports and resistance. Don't get simpler than that, pocket 50% on the move

#APE/USDT#APE
The price is moving within a descending channel on the 1-hour frame, adhering well to it, and is heading for a strong breakout and retest.
We are seeing a bounce from the lower boundary of the descending channel, which is support at 0.5060.
We have a downtrend on the RSI indicator that is about to be broken and retested, supporting the upward trend.
We are looking for stability above the 100 moving average.
Entry price: 0.5386
First target: 0.5528
Second target: 0.5720
Third target: 0.5887

Beautiful APEThis asset moving between horizontal so perfectly. Finding support on the monthly and daily below, moving up into weekly and full range point of control.... (Lil POC is the previous mini range point of control) . Lovely the volume not what it used to be on APE but still fun to trade

APE Main trend. Channel. Wedge. Reversal zones 05 05 2025Logarithm. Time frame 1 week.
1️⃣ Decline from the maximum by -98% , which is acceptable for assets of such liquidity and capitalization, after that either a trend reversal (main), or a complete scam.
2️⃣X (twitter) of this crypto project has 473 thousand subscribers . This army will be sent to pump this cryptocurrency at the right time in the so-called 3rd alt season of this cycle.
🟣And now work with a breakout of the descending wedge, and the price movement to the resistance of the descending channel. The percentage locally - medium-term showed for clarity from two zones - scenarios.
3️⃣The third plus is that this cryptocurrency is traded on 4 liquid exchanges: binance, bybit, okx, and most importantly Coinbase.
Line chart (trend direction and liquidity).

APEUSDT WXY Correction and Long Accumulation SetupAPEUSDT has undergone an extensive corrective structure, which unfolds in a clear WXY complex pattern. The terminal point of this correction appears to have completed with a potential five-wave impulse to the downside, suggesting capitulation and a shift in directional bias.
The immediate demand zone, aligned with historical accumulation and confluence of prior reaction levels, presents a technically favorable area for strategic long accumulation. Price currently hovers near 1.4665, a critical level likely to act as a liquidity magnet and interim resistance before any substantial bullish continuation can materialize.
The structural roadmap anticipates a recovery phase, contingent on sustained demand within this zone. However, the final projected upside target aligns with the macro supply zone around 6.2213, where historical sell-side activity is expected to resume. This level is marked as the primary distribution zone and should be monitored closely for potential reversal setups or exit strategies.

APE: Ending a Complex Bearish Trend#APE has been in a bearish trend since launching in April 2022. Now near an ATL, it recently bounced off a key Fib extension level.
With a stop-loss below $0.40 and a major trend shift above $2.20, a strong reversal is currently needed for future bullish targets.
#Apecoin

APE/USDT 1W🌱 GETTEX:APE ⁀➷
#ApeCoin. Macro chart Another
🐛 Intermediate Target - $3.31
🍃 Macro Target 1 - $5.38
🍃 Macro Target 2 - $10.30
🍃 Macro Target 3 - $18.28
- Not financial advice, trade with caution.
#Crypto #ApeCoin #APE #Investment
✅ Stay updated on market news and developments that may influence the price of Ape Coin. Positive or negative news can significantly impact the cryptocurrency's value.
✅ Exercise patience and discipline when executing your trading plan. Avoid making impulsive decisions driven by emotions, and adhere to your strategy even during periods of market volatility.
✅ Remember that trading always involves risk, and there are no guarantees of profit. Conduct thorough research, analyze market conditions, and be prepared for various scenarios. Trade only with funds you can afford to lose and avoid excessive risk-taking.

#APE/USDT#APE
The price is moving within a descending channel on the 1-hour frame, adhering well to it, and is heading for a strong breakout and retest.
We are seeing a bounce from the lower boundary of the descending channel, which is support at 0.4548.
We have a downtrend on the RSI indicator that is about to be broken and retested, supporting the upward trend.
We are looking for stability above the 100 moving average.
Entry price: 0.4875
First target: 0.4718
Second target: 0.4794
Third target: 0.4875
