APEUSDT Elliott Waves AnalysisHello friends.
Please support my work by clicking the LIKE button👍(If you liked). Also i will appreciate for ur activity. Thank you!
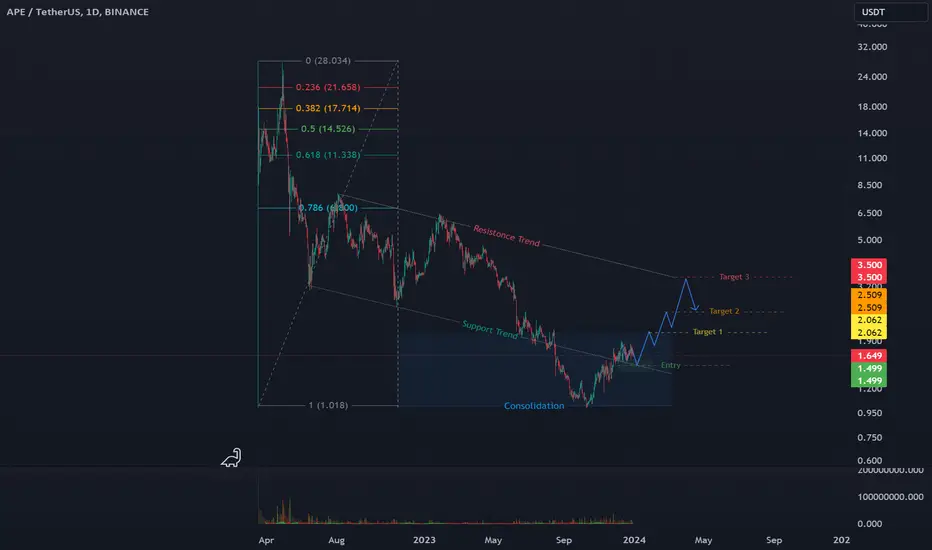
Everything on the chart.
Entry: Market and lower
Targets: 2 - 2.3 - 2.6
Stop: under 1.25 (depending of ur risk).
RR: 1 to 3
ALWAYS follow ur RM.
risk is justified
Good luck everyone!
Follow me on TRADINGView, if you don't want to miss my next analysis or signals.
It's not financial advice.
Dont Forget, always make your own research before to trade my ideas!
Open to any questions and suggestions
APEUSDT trade ideas

APE : BREAKOUT LONG SIGNAL : THIS MONKEY'S ABOUT TO MAKE A RUN! Refer to previous post.
The entire market is heading up..
I'm not here to earn a degree in crypto waffle. There are enough wafflers. Saturated market..
Buy at current price..


APE/USDT bullish horizons from demand? 👀🚀 APE Analysis💎 Paradisers, turn your attention to #APEUSDT, which is showing signs of a noteworthy shift from a vital demand level.
💎 Currently, #APE is charting an upward path, hinting at a potential bullish breakout from its current demand zone. We're eyeing a retest of the demand level around $1.292 before it resumes its ascent. Should #APE maintain its ground above this threshold, it sets the stage for an advance towards the significant supply zone at $2.906.
💎 However, should #ApeCoin struggle to hold above the $1.292 level, it may call for a strategic reassessment. In this scenario, we'd consider the possibility of initiating a bullish movement from a lower demand level at $1.137, which holds substantial liquidity.
💎 Monitoring this level is imperative, as breaking below it could trigger a pronounced bearish trend.

APE: Approaching ResistanceTrade setup : Following a bearish breakout from a Channel Up pattern and below 200-day moving average, price could signal bearish trend reversal near-term with downside risk to $1.00.
Pattern : Price was trading in a Channel Up pattern. With emerging patterns, traders who believe the price is likely to remain within its channel can initiate trades when the price fluctuates within its channel trendlines. With complete patterns (i.e. a breakout) – initiate a trade when the price breaks through the channel’s trendlines, either on the upper or lower side. When this happens, the price can move rapidly in the direction of that breakout.
Trend : Downtrend on Short- and Medium-Term basis and Uptrend on Long-Term basis.
Momentum is Bearish but inflecting. MACD Line is below MACD Signal Line and RSI is below 45 but momentum may have bottomed since MACD Histogram bars are rising, which suggests that momentum could be nearing another upswing.
Support and Resistance : Nearest Support Zone is $1.00. The nearest Resistance Zone is $1.50 (previous support), then $2.00.


APE: Channel Up BreakoutTrade setup : Bearish breakout from a Channel Up pattern could signal bearish trend reversal near-term with downside risk to $1.00.
Pattern : Price was trading in a Channel Up pattern. With emerging patterns, traders who believe the price is likely to remain within its channel can initiate trades when the price fluctuates within its channel trendlines. With complete patterns (i.e. a breakout) – initiate a trade when the price breaks through the channel’s trendlines, either on the upper or lower side. When this happens, the price can move rapidly in the direction of that breakout.
Trend : Downtrend on Short- and Medium-Term basis and Uptrend on Long-Term basis.
Momentum is Bearish (MACD Line is below MACD Signal Line, and RSI is below 45).
Support and Resistance : Nearest Support Zone is $1.00. The nearest Resistance Zone is $1.50 (previous support), then $2.00.

APE PrdectionFrom the current price i can see that APE can do a retest to 1$ it will be a good buying potential for me.
Main target is 10$, please DYOR
This is not a financial advice.
#APE#NFT to the moon

PRICE PREDICTION for Apecoin – APE/USDTfind out my idea according to that chart its clear wolf waves

ApeWell, in a way, I was relieved to confirm the etf with the news I heard and Bolran is just starting. This currency that I bought today is at a great price floor. With a stop, we can even have a long-term approach.

APE BUY SETUPHi Everyone!
APE setup today
APE Analyze ( APEUSDT.P ), 15 Minute time frame ⏰
APE looking good to buy, if you want to BUY APE, you can BUY in RETEST AREA
but, Don't forget set up your trading plan, risk reward
Good luck Guys!
*Follow For More!
*DYOR

APE: Channel Up BreakoutTrade setup : Bearish breakout from a Channel Up pattern could signal bearish trend reversal near-term with downside risk to $1.00.
Pattern : Price was trading in a Channel Up pattern. With emerging patterns, traders who believe the price is likely to remain within its channel can initiate trades when the price fluctuates within its channel trendlines. With complete patterns (i.e. a breakout) – initiate a trade when the price breaks through the channel’s trendlines, either on the upper or lower side. When this happens, the price can move rapidly in the direction of that breakout.
Trend : Downtrend on Short-Term basis, Neutral on Medium-Term basis and Uptrend on Long-Term basis.
Momentum is Bearish (MACD Line is below MACD Signal Line, and RSI is below 45).
Support and Resistance : Nearest Support Zone is $1.50, which it broke, then $1.00. The nearest Resistance Zone is $2.00, then $2.50.

APE can pump 400% from hereApeCoin is an ERC-20 governance and utility token used within the APE Ecosystem to empower and incentivize a decentralized community building at the forefront of web3.
ApeCoin holders govern themselves via the decentralized governance framework controlling the ApeCoin DAO, and vote on how the ApeCoin DAO Ecosystem Fund should be used. The APE Foundation administers proposals agreed upon by ApeCoin holders.

APE: Head & Shoulders PatternAPE: Head & Shoulders Pattern
After yesterday's crash on the crypto market, we can see that APE completed a Head and Shoulders pattern.
The chances are high that APE can move down again even if it will retest 1.5800
APE has long time that keeps struggling to rise but it failed many times.
This is another reason that gives more value to the bearish scenario.
You may find more details in the chart!
Thank you and Good Luck!

#APEIn the H4, it is moving in an ascending channel, which is the specified trading range. If a rejection candle or return candle is placed in the green box, you can enter into a sale transaction up to the bottom of the channel.

#APE #Technical #Analysis #VIP #Eddy#APE #Technical #Analysis #VIP #Eddy
The analysis is on request and I made the chart for you in an educational way. Please also pay attention to the following explanations:
The green line that I specified is a PRZ point, which has become a static support and has a lot of power. Also, let's look at the multi-time frame with ICT and RTM tricks. And in Pullback, FTRs can also be triggered. Classically, our PRZ point has a very beautiful double bottom, the time frame is daily, the stops are not logical, the entry point and the trading stop are excellent, look for the entry trigger in the lower time frame. Please do not log in without getting confirmation and do so at your own risk. This analysis is suitable for traders, if you don't know how to trade and manage capital and risk, this analysis is not suitable for you.
The World Let it be Remembered...
Dr. #Eddy Sunshine
1/3/2024
Happy New Year <3 Enjoy ;-)


APE: Channel UpTrade setup : Price is trading in a Channel Up pattern.
Swing traders: can enter near Channel support trendline (~$1.70) and exit near Channel resistance trendline (~$2.00). Stop Loss (SL) at $1.45. Also, price needs to break above 200-day moving average to confirm a bullish trend reversal to an Uptrend.
Pattern : Price is trading in a Channel Up pattern. With emerging patterns, traders who believe the price is likely to remain within its channel can initiate trades when the price fluctuates within its channel trendlines. With complete patterns (i.e. a breakout) – initiate a trade when the price breaks through the channel’s trendlines, either on the upper or lower side. When this happens, the price can move rapidly in the direction of that breakout.
Trend : Uptrend across all time horizons (Short- Medium- and Long-Term).
Momentum is Mixed as MACD Line is below MACD Signal Line (Bearish) but RSI ~ 50 (Neutral). MACD Histogram bars are rising, which suggests that momentum could be nearing another upswing.
Support and Resistance : Nearest Support Zone is $1.50 (previous resistance), then $1.00. The nearest Resistance Zone is $2.00, then $2.50.

APE LONGAPE started its reversal where it hit all time low last year at around $1. It time to send this back to two digits. HODL and wait for the massive bullrun.

dont miss opportunities this chart Apeusdt have strong support at 1.580.
Buy at 1.580, takeprofit at 2.064

APE/USDT | 1d 👀1. We've entered the crucial trend break zone.
2. Observing a potential fractal that could influence $APE. This might signify the commencement of the altcoin season. Let's wait and see...
Not financial advice, trade with caution.
✅ Stay updated on market news and developments that may influence the price of Apecoin. Positive or negative news can significantly impact the cryptocurrency's value.
✅ Exercise patience and discipline when executing your trading plan. Avoid making impulsive decisions driven by emotions, and adhere to your strategy even during periods of market volatility.
✅ Remember that trading always involves risk, and there are no guarantees of profit. Conduct thorough research, analyze market conditions, and be prepared for various scenarios. Trade only with funds you can afford to lose and avoid excessive risk-taking.
#Crypto #Apecoin #Trading #APE
APEUSDTAPE is ready to make a noise 100% to 600% short midterm
follow and support and buy with red and be patiant
NFA AND DYOR

APE: Channel UpTrade setup : Price is trading in a Channel Up pattern. Swing traders: can enter near Channel support trendline (~$1.70) and exit near Channel resistance trendline (~$2.00). Stop Loss (SL) at $1.45. Also, price needs to break above 200-day moving average to confirm a bullish trend reversal to an Uptrend.
Pattern : Price is trading in a Channel Up pattern. With emerging patterns, traders who believe the price is likely to remain within its channel can initiate trades when the price fluctuates within its channel trendlines. With complete patterns (i.e. a breakout) – initiate a trade when the price breaks through the channel’s trendlines, either on the upper or lower side. When this happens, the price can move rapidly in the direction of that breakout.
Trend : Uptrend across all time horizons (Short- Medium- and Long-Term).
Momentum is Mixed as MACD Line is below MACD Signal Line (Bearish) but RSI ~ 50 (Neutral).
Support and Resistance : Nearest Support Zone is $1.50 (previous resistance), then $1.00. The nearest Resistance Zone is $2.00, then $2.50.
